A B2B discovery case study about fixing your experiment: testing a feature for encoway's new P2M product
Stay up to date with the latest insights
When my coachee Bergen Helms, New Business Lead PM at encoway GmbH whose product teams I've been supporting as product discovery coach, joined our call, I could tell he was excited.
He’d just run an experiment he was sure had worked.
"Look at this," he said, pulling up a spreadsheet. "We ran the experiment. Seven sales calls. Five of them saw the sales anomaly feature. Two prospects are excited about it. They're saying things like 'this is exactly what we need' and 'this could be a game-changer for us.'"
He thought his hypothesis was validated, but when we dug into what he had actually tested, things turned out to be quite different.
This case study is about how a "successful" experiment can still validate nothing, because the hypothesis was measuring the wrong signal for how B2B buying actually works.
It is supposed to give you an idea of the real, messy world of discovery, an example of how to analyse your own hypotheses and tests, and an inspiration of how to connect frameworks to come up with assumptions and experiments (yes, Impact Mapping is part of it).
The product they are building
Before we get into what went wrong, let me give you some context about what they're building.
This is a B2B sales management tool for the industry of variant manufacturers.
Their clients are businesses with massive product catalogues, which include products with different margins. While the sales teams are familiar with the more popular products, these might not be the ones with better margins, so they never get recommended. The new tool my client was building - Product-to-Market or short P2M - helps Sales see which higher-margin products they should be suggesting instead.
The problem: customers see P2M as a vitamin, not a painkiller.
In theory, every business wants to optimise margins. But the decision makers in sales didn’t feel a strong enough urgency to buy because they were not incentivised to maximise margins but to maximise revenue / order intake instead.
So Bergen's team built the Impact Board, a feature that makes value immediately visible to prospects during a sales demo, turning it from a nice-to-have into something that felt urgent. Customer sales anomalies was the first use case they decided to surface on it: a way to predict when a customer is about to churn, giving Sales a warning so they can get proactive before it's too late.
The big question they needed to answer with their experiment was: “Can this sales anomaly feature create enough of a painkiller perception that leads would want to buy the whole product?”
And that's where we started our work.
How we got there
It all started with Impact Mapping.
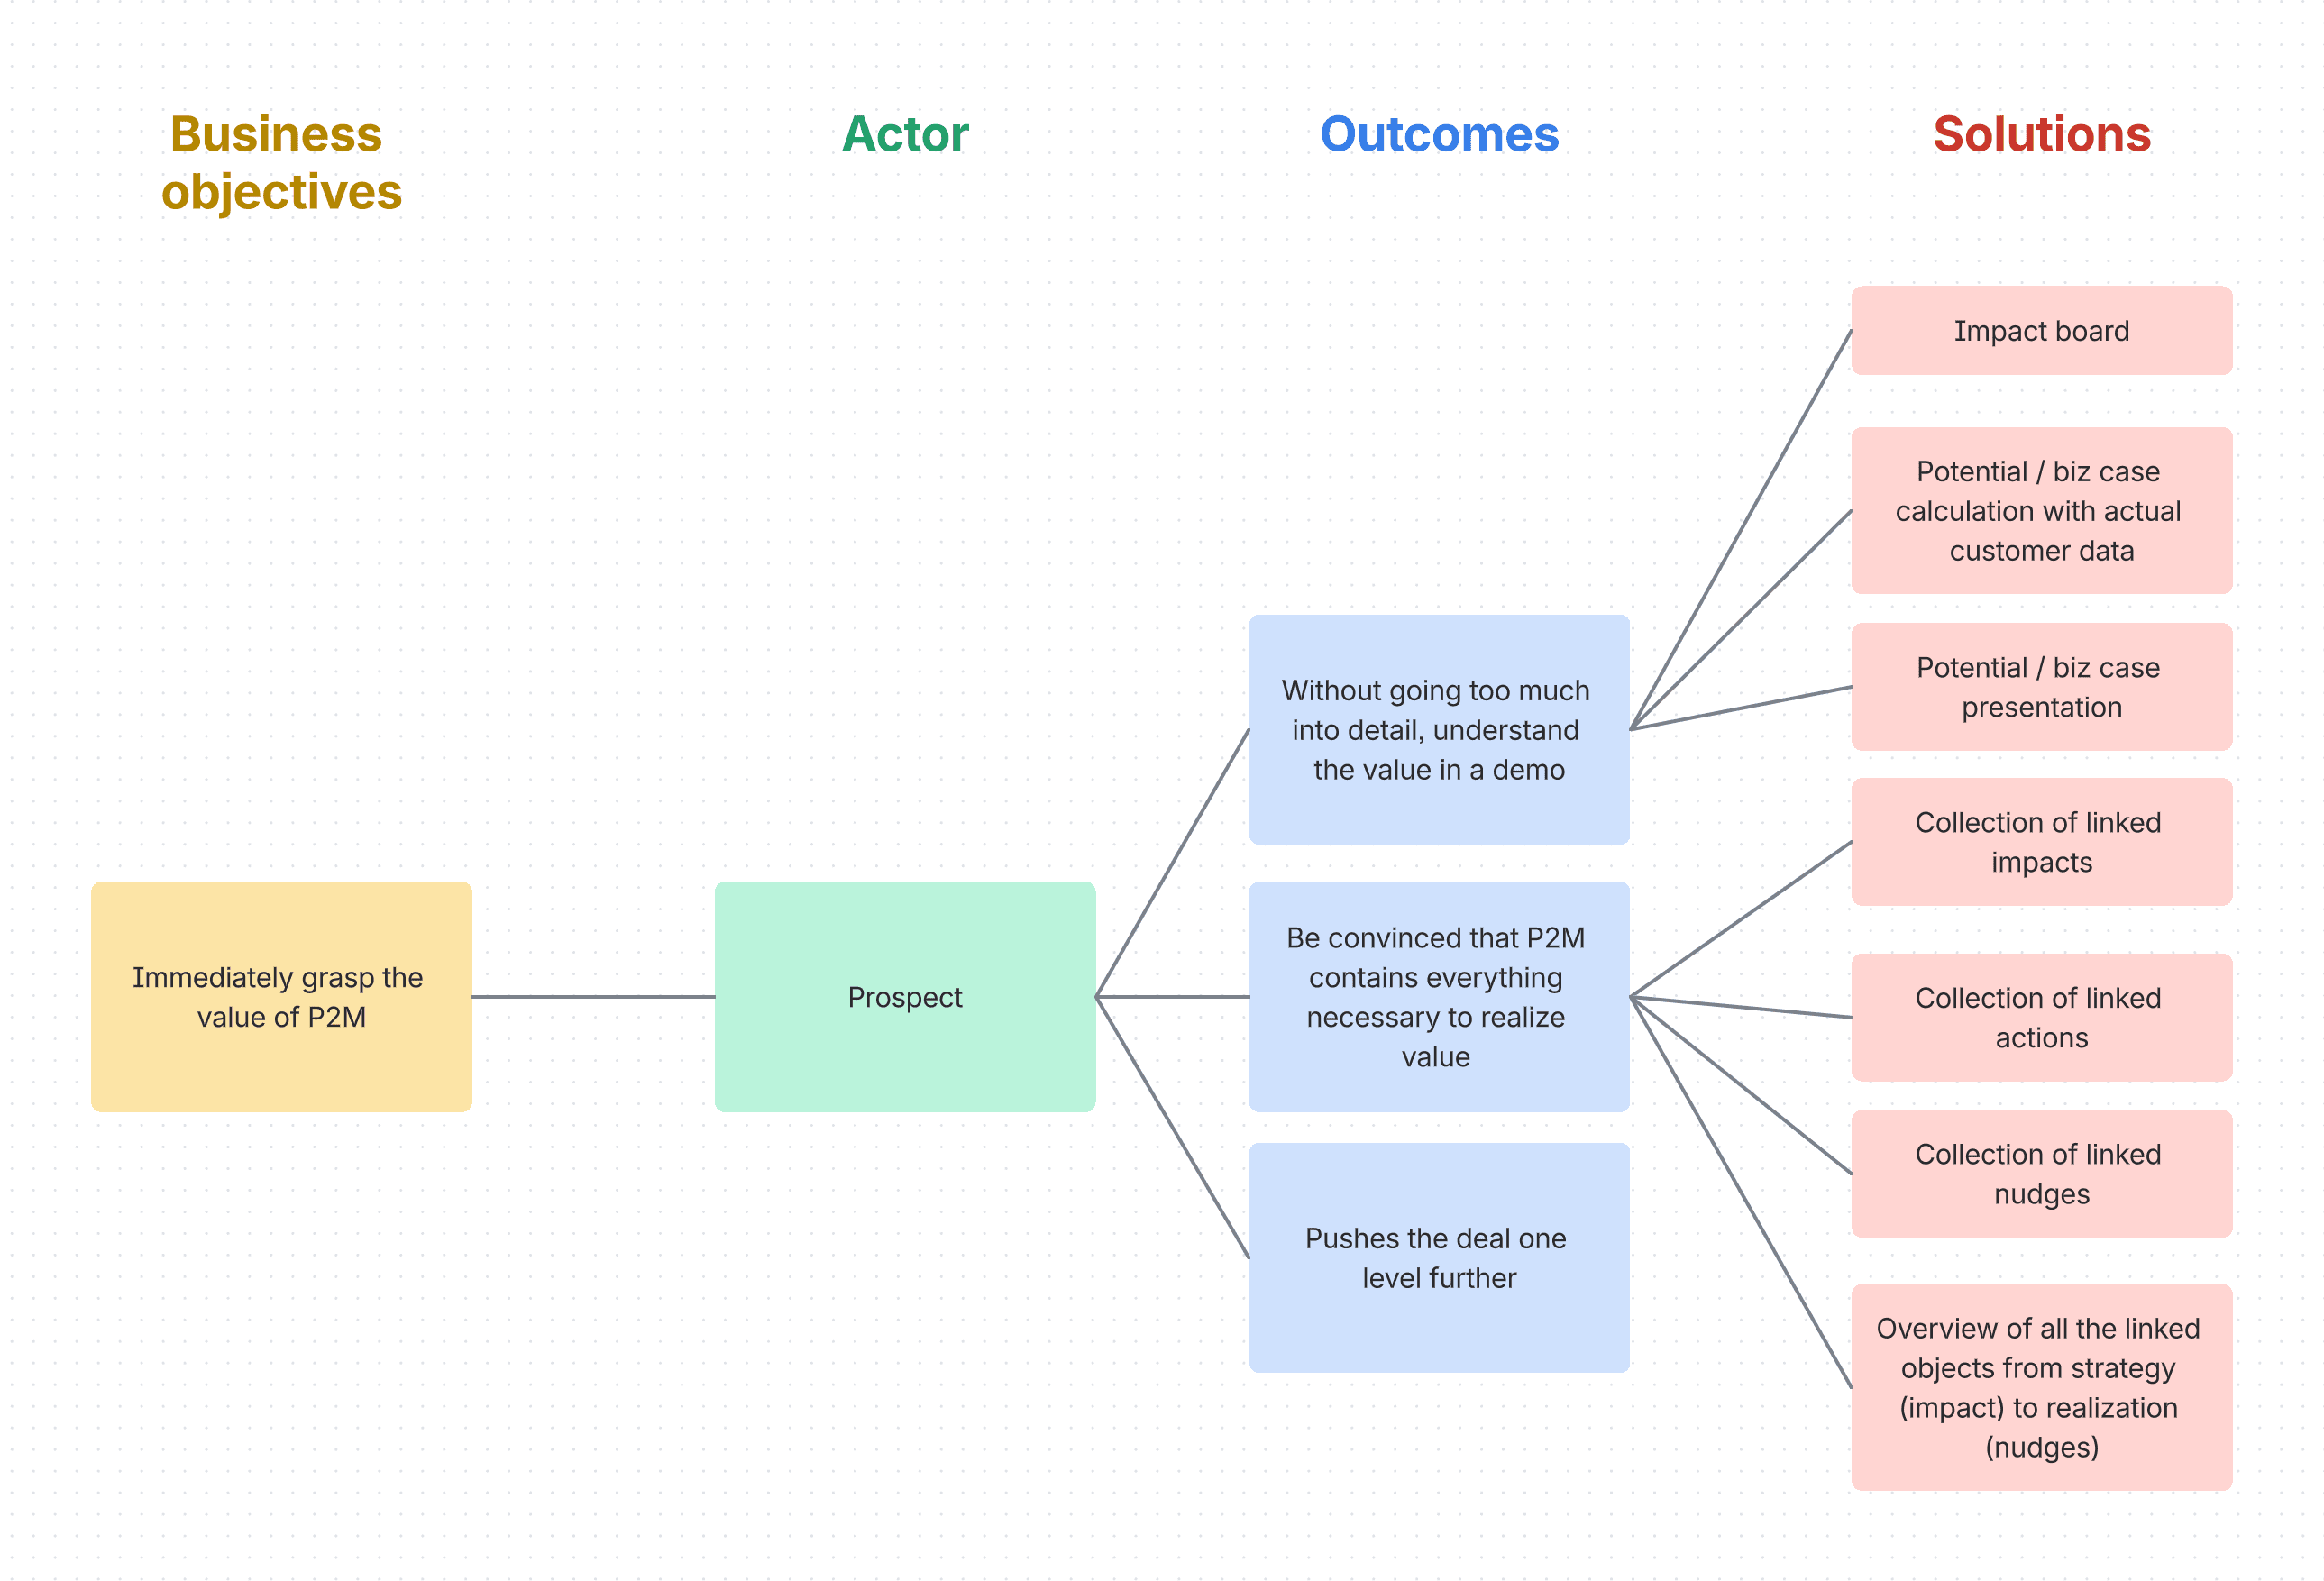
The goal was to figure out how to package this calculation functionality into an actual customer-facing feature. The team mapped out their business goal for their product P2M (Product-to-Market), identified the actors involved, defined the outcomes they wanted to see, and started listing possible solutions.
Here is the Impact Map of the impact board (click to enlarge):
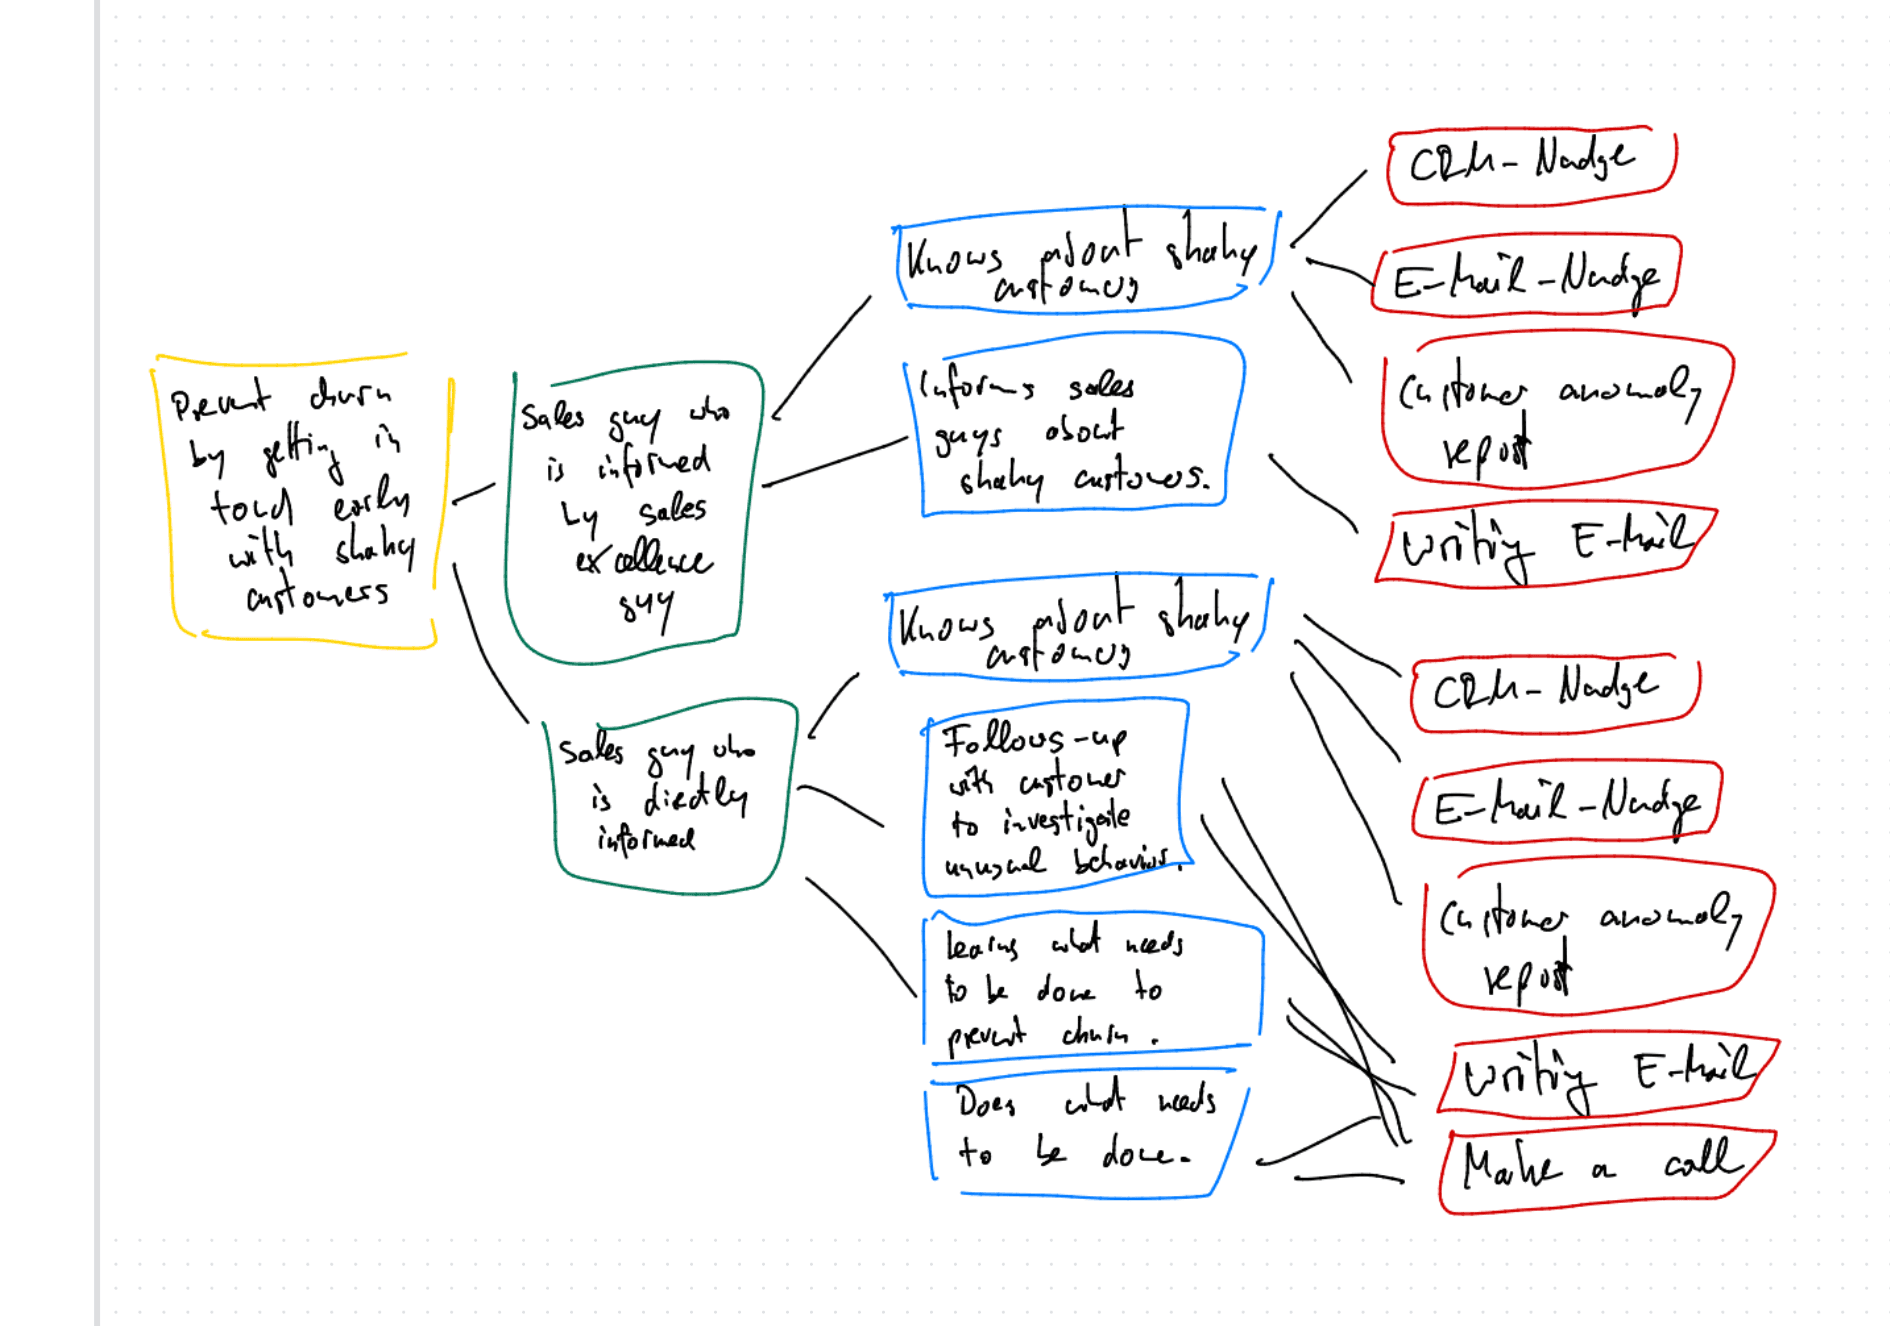
And this is the Impact Map of the sales anomaly feature, sketched during a 15-20 train ride (it can be that easy):
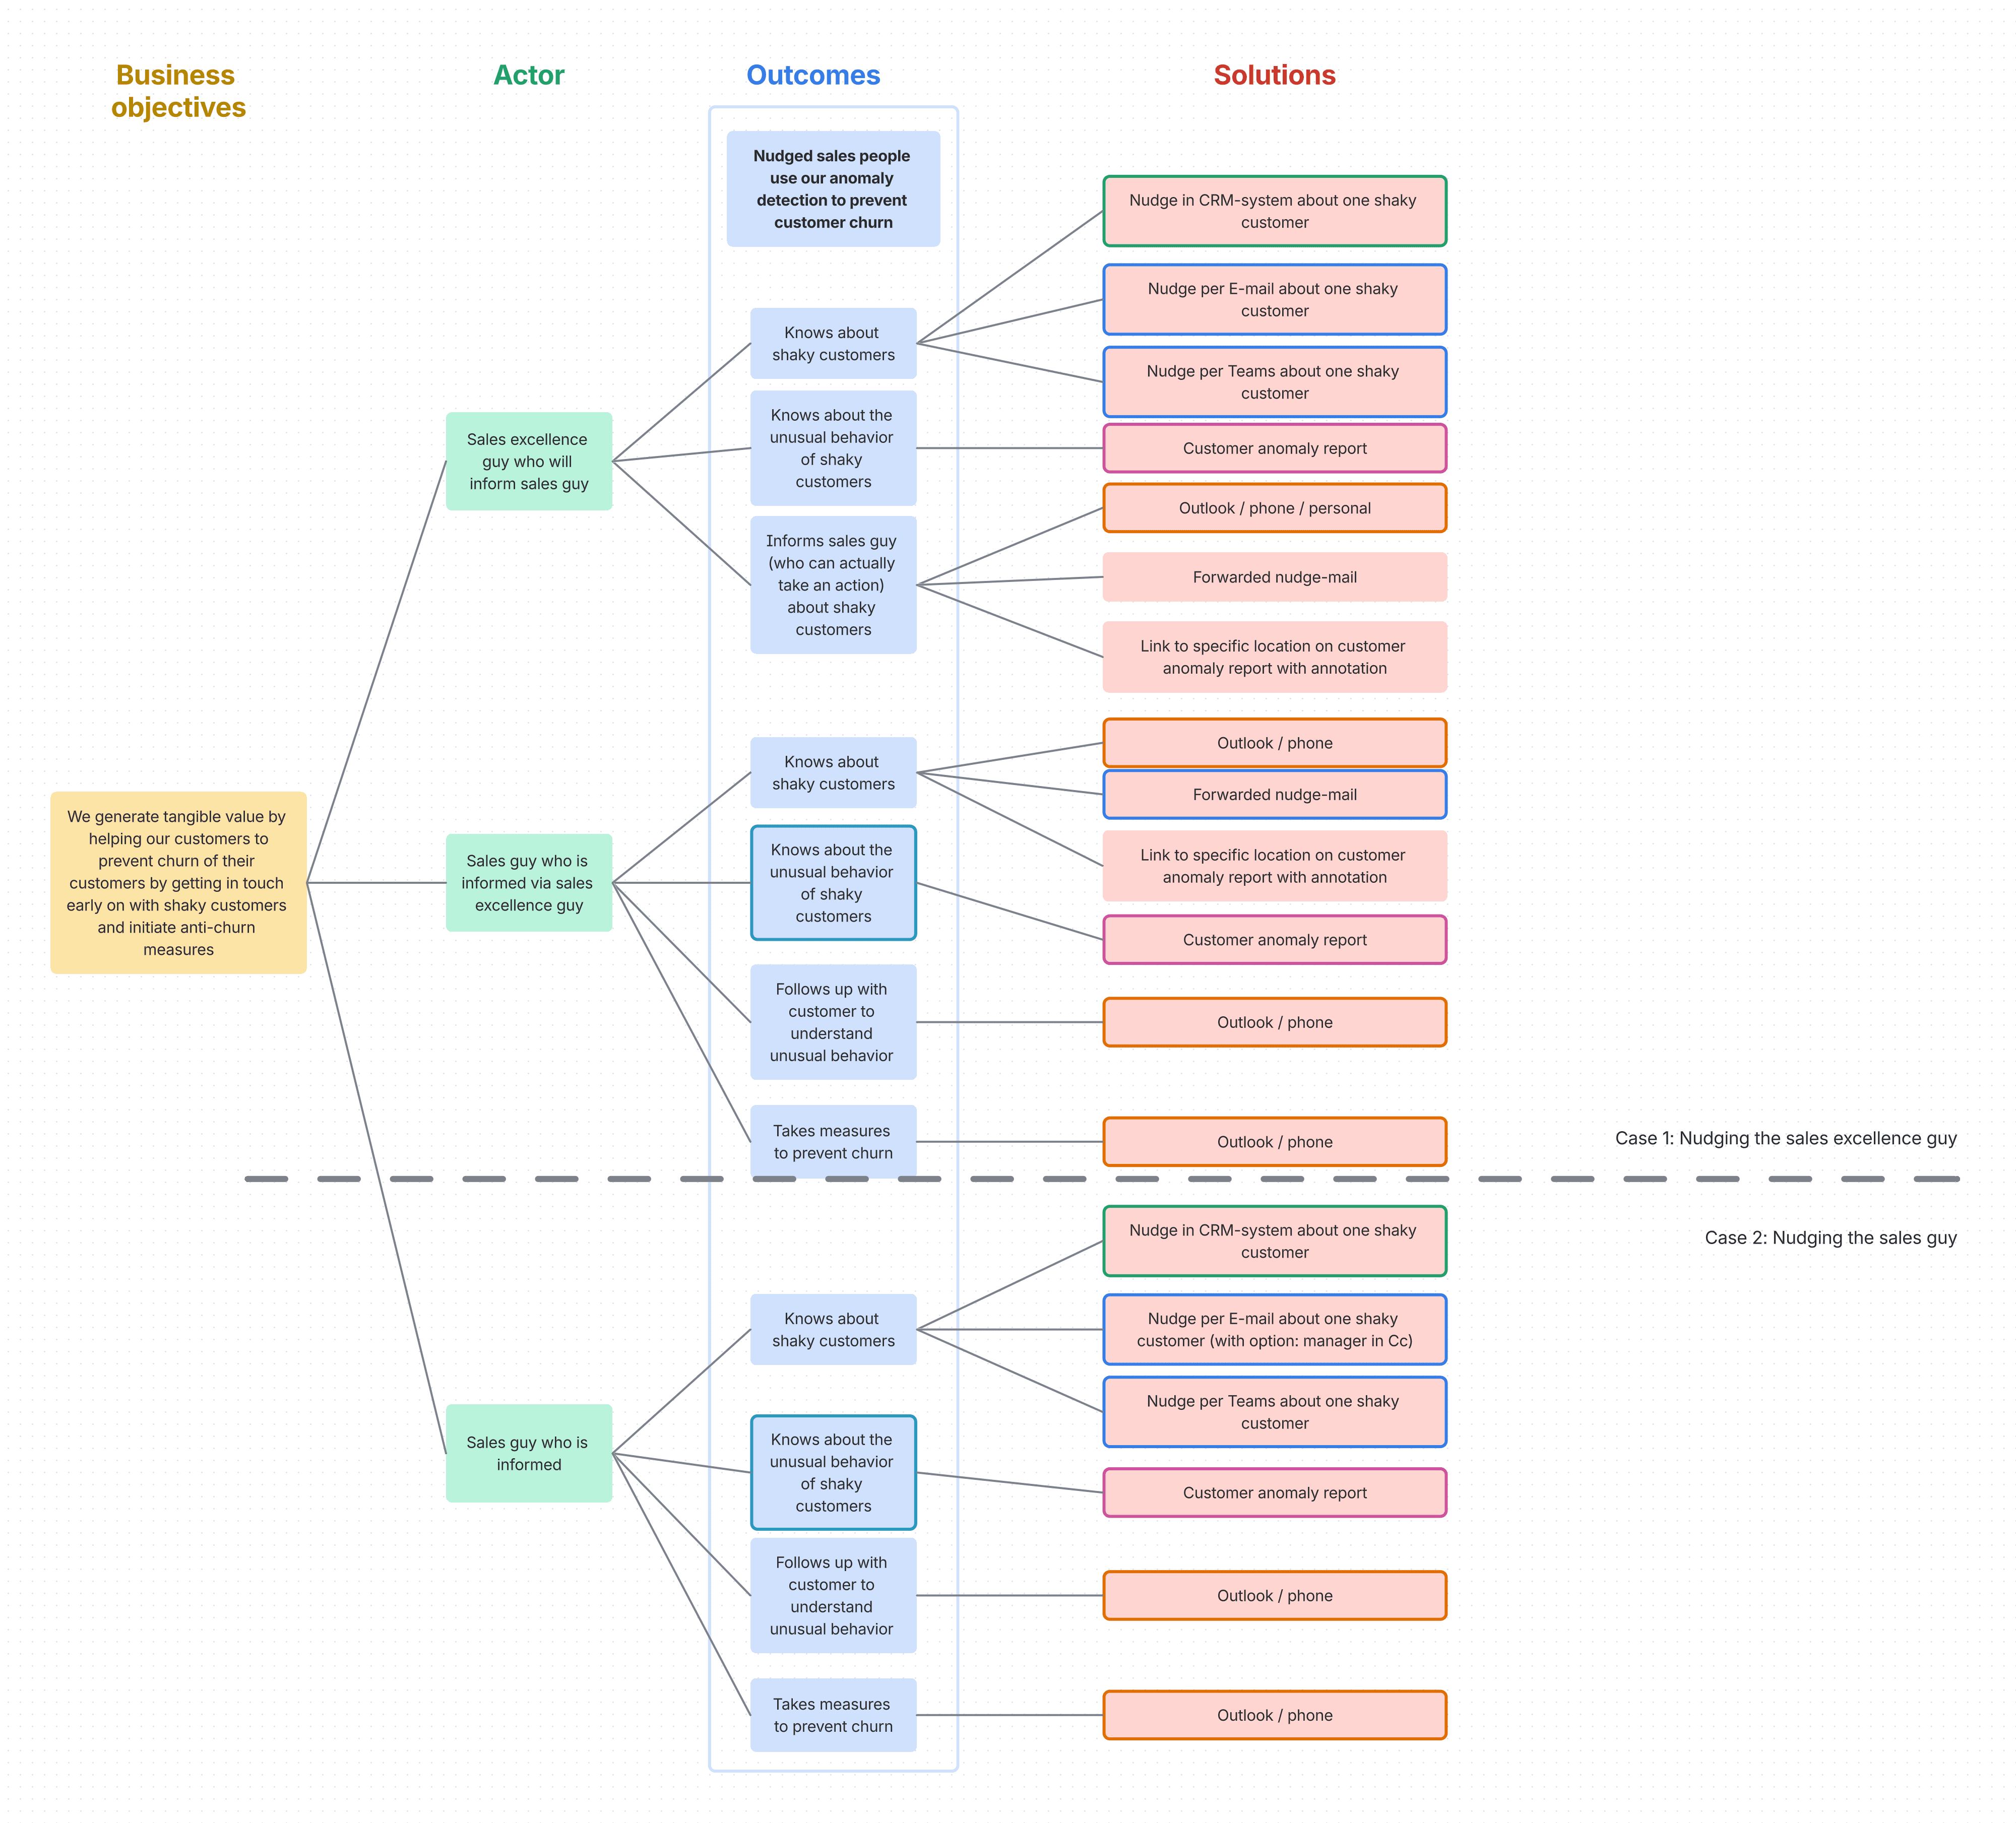
Transferred into Atlassian:
But here's what made it different: as they built the map, they didn't just create the structure and moved on. They also identified the biggest assumptions right there, on each level of the Impact Map itself.
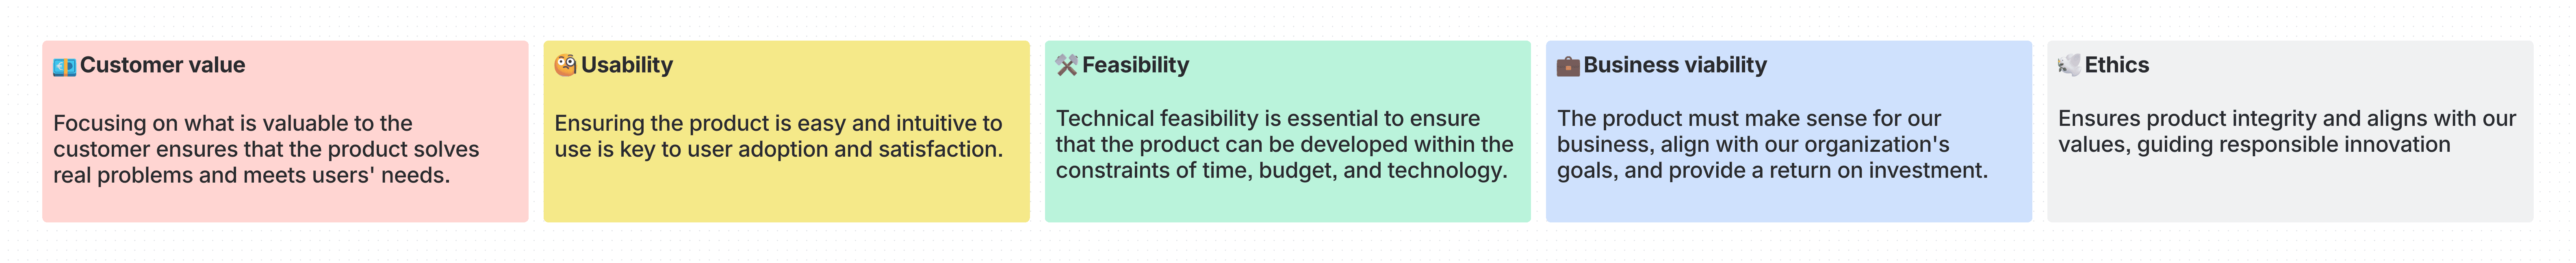
They also colour-coded the assumptions as they went:
red = customer value
yellow: usability
green: feasibility
blue: Business viability
grey: ethics - Yes there was even an assumption related to ethics, which is rare but worth surfacing when it happens. I love it!
Here you can see the assumptions they’ve surfaced from and mapped to the Impact Map:
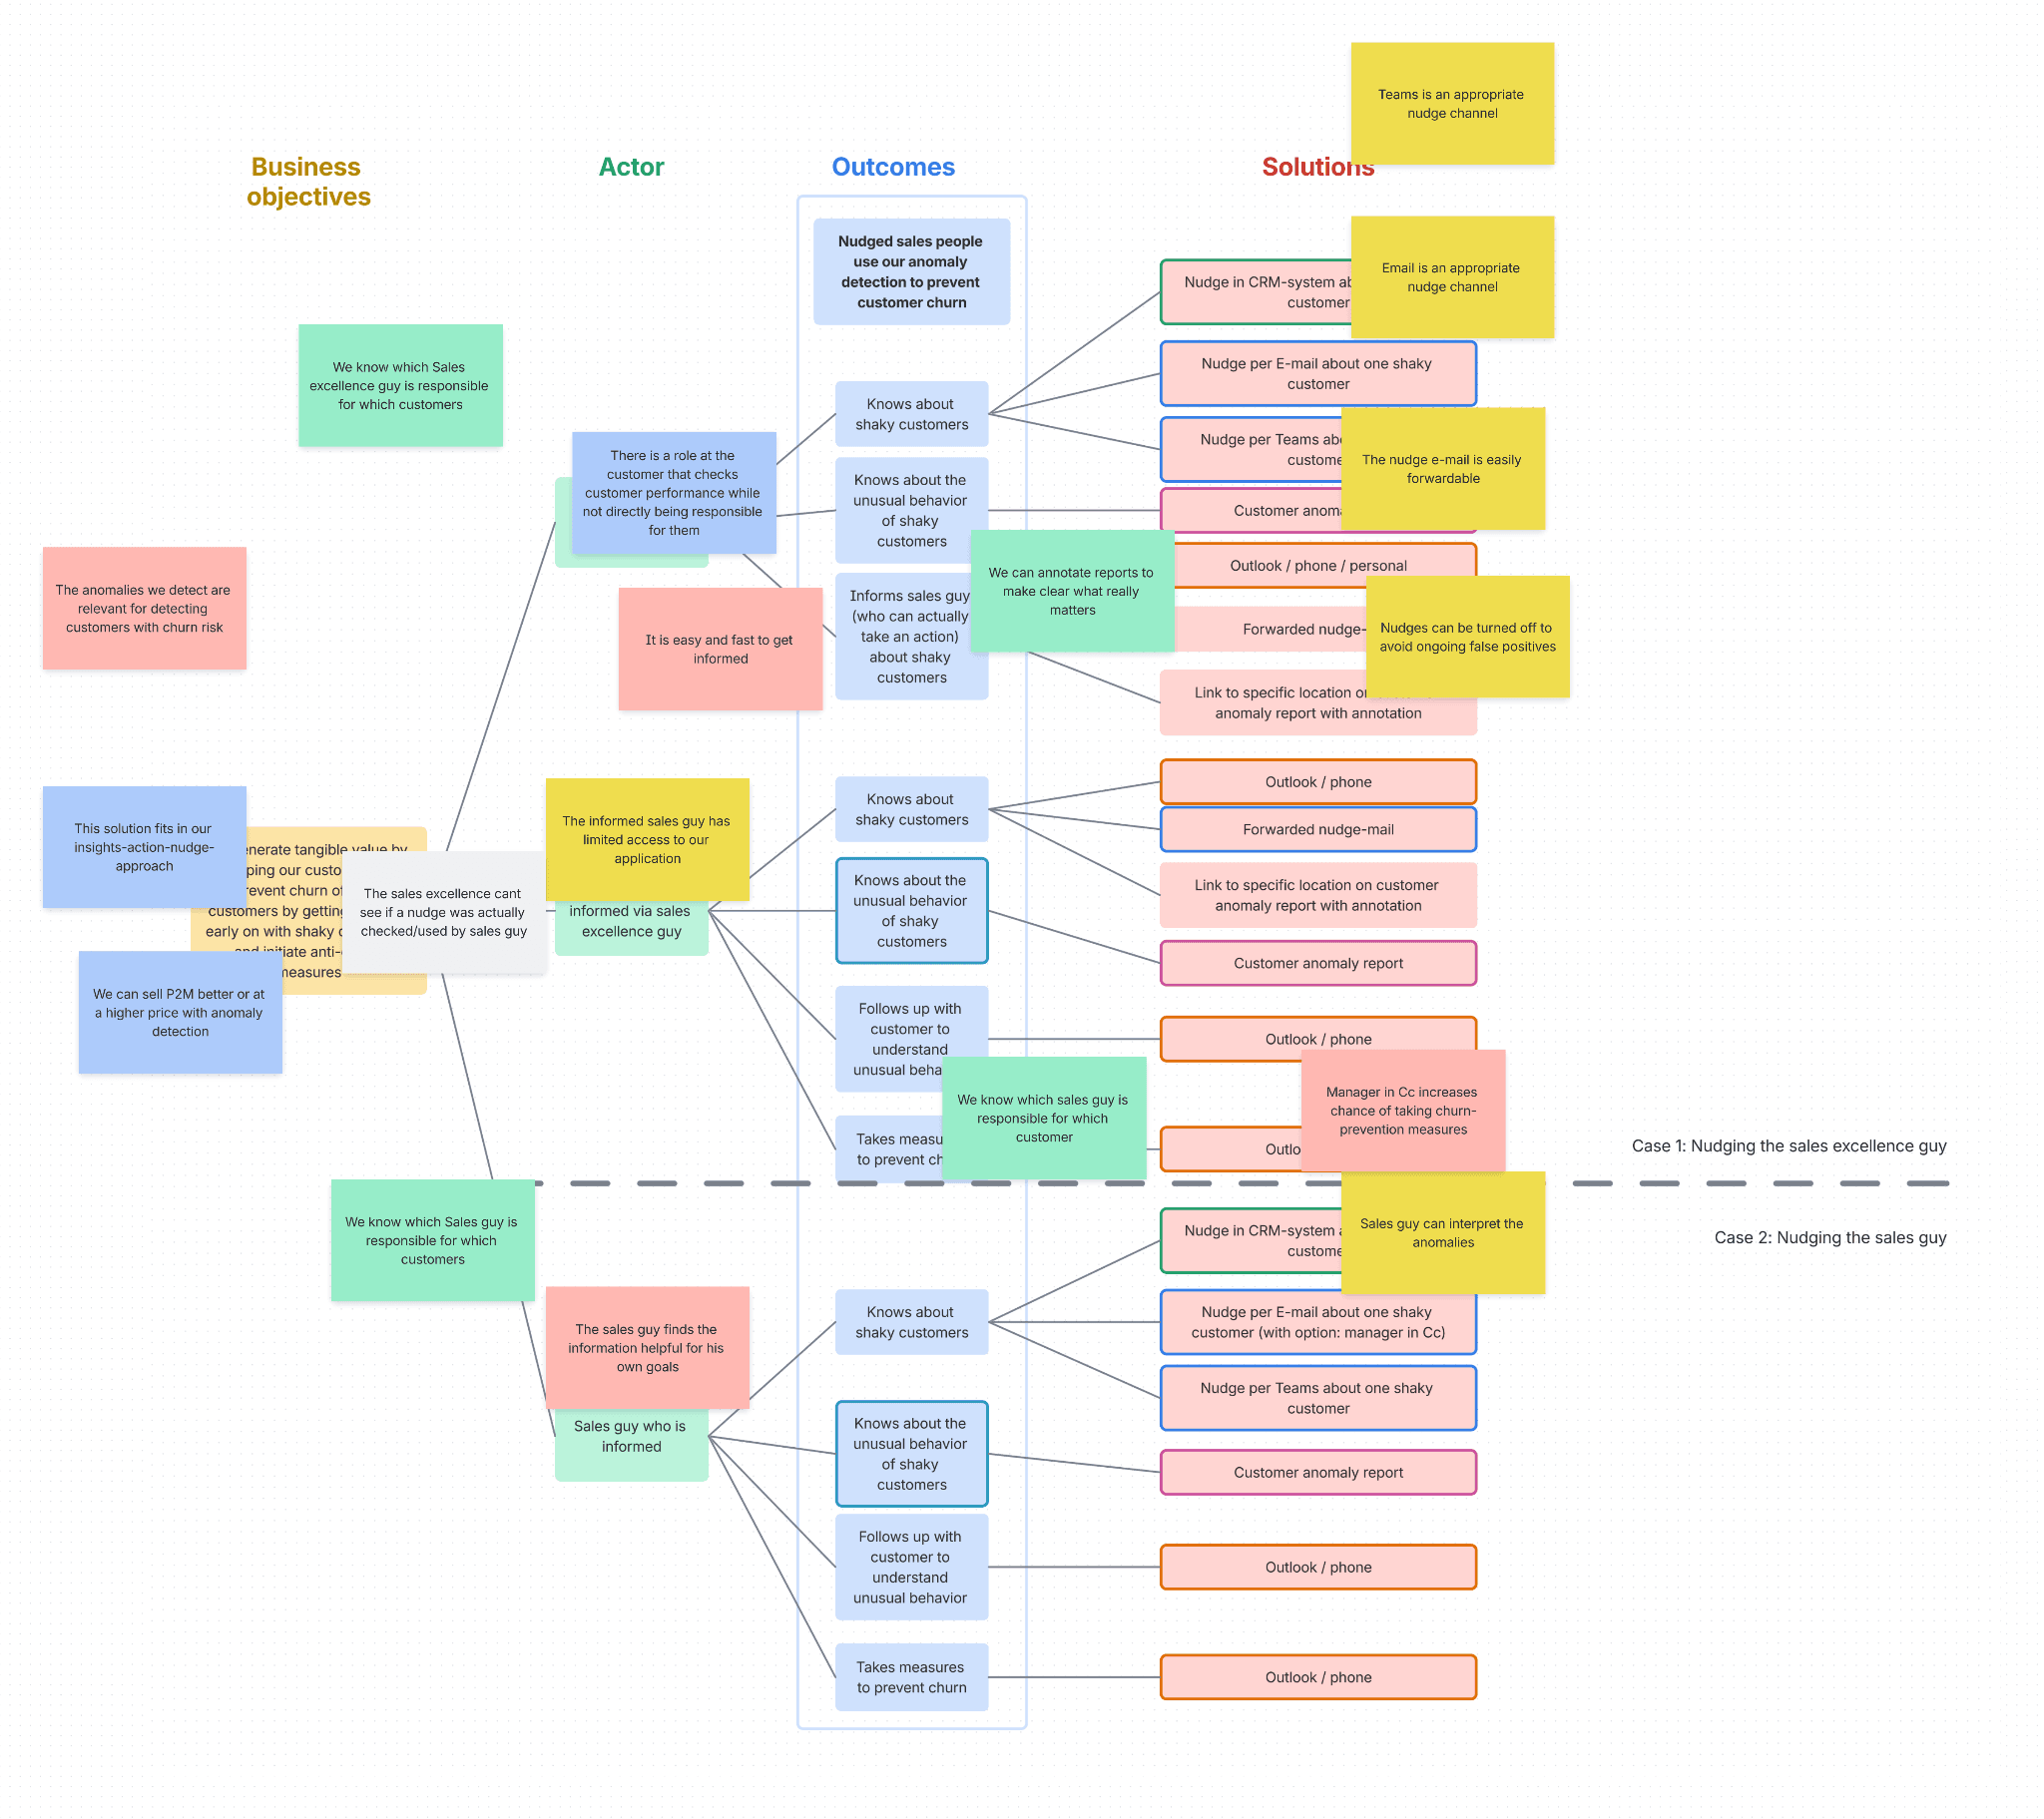
Pretty quickly, it became clear that most solutions had desirability assumptions attached. Remember: Desirability = Usability for users (yellow), Value for buyers (red). A few had usability assumptions. But the real value assumptions, the ones that would make or break the product, were sitting in the space between actor and outcome. That's where the uncertainty lived.
They only wrote stickies for the most important assumptions. If something felt like an assumption but wasn't critical, they didn't bother documenting it. This kept them focused, as the Impact Map also served as a filtering tool.
Then they took those assumptions and mapped them onto an Assumptions Map.
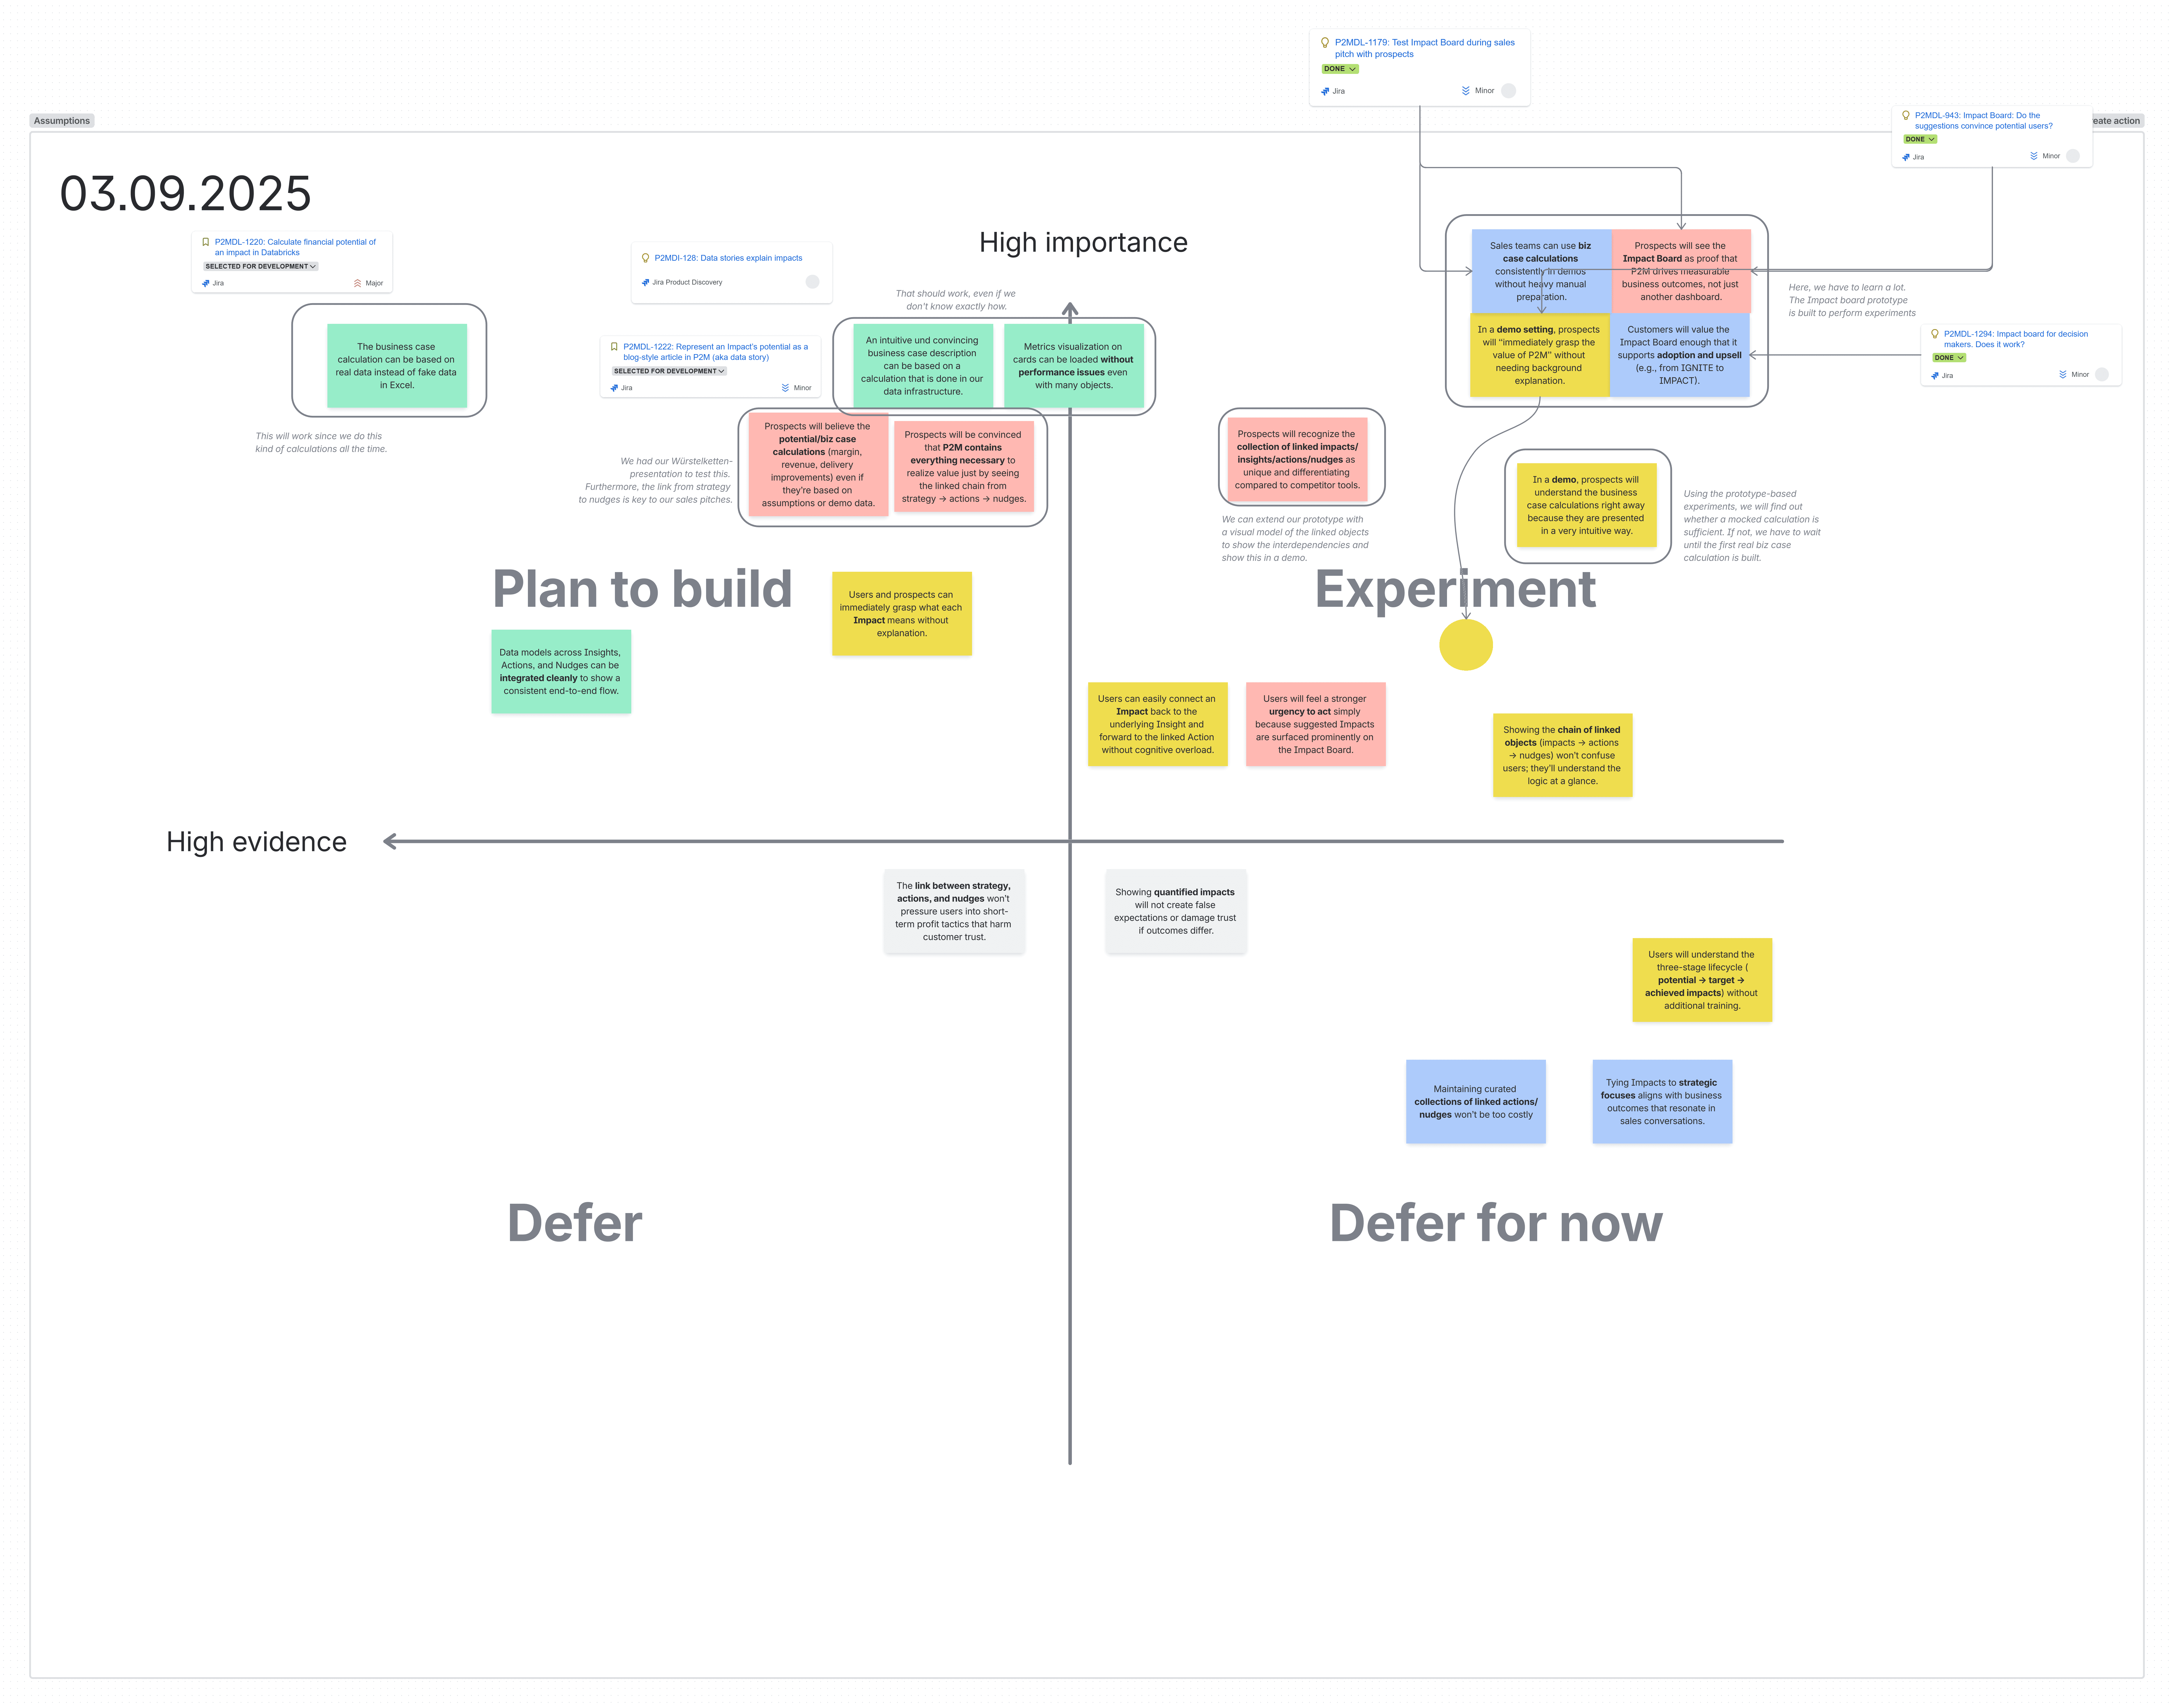
The goal was to find assumptions that sit in the top-right quadrant (high importance and low evidence), because those are the riskiest ones, the ones that can kill your product if you get them wrong.
Within that top-right quadrant, they focused on the very top-right corner. The assumptions with the least evidence and the highest stakes.
The Impact Board acted as the interface layer: a way to make impacts, actions, nudges, and business outcomes visible and understandable to both Sales teams and prospects. Within that, the sales anomaly functionality was a specific use case designed to surface churn risks and create urgency during sales conversations.
From there, the team derived assumptions specifically about this sales anomaly use case, namely:
Displaying sales anomalies on the Impact Board helps the Sales team communicate value more effectively during sales conversations.
Displaying sales anomalies as a concrete example within the Impact Board creates enough urgency and perceived value to make the product feel like a painkiller rather than a vitamin.
With those two assumptions identified, they moved on into experiments.
Bergen wrote two hypotheses, designed a test, and got his Sales colleague involved. The plan was to conduct sales calls with prospects, show them the sales anomaly feature (either in a demo or a presentation), and track what happened.
Sales ran seven calls. In five of them, he showed the feature. In two of those, the prospects gave strong, excited feedback. From the outside, it looked like the experiment worked.
When "working" isn’t working
But then we sat down and reviewed the hypothesis itself. It said:
“We'll know this is working if 7 out of 10 leads show buying intent.”
The reality: none of them had shown buying intent.
Not even the two who were excited. Not even one who set up a follow-up call. They showed enthusiasm, but interest and buying intent are not the same thing, especially not in a B2B environment with long sales cycles, multiple stakeholders, and months between the first contact and the closure of the deal.
Bergen had written an experiment that asked for a signal that was never going to show up in the timeframe he was testing. In his industry, buying intent doesn't happen on the first call. It happens after multiple meetings, after you've brought in more senior decision-makers, after legal has reviewed terms, and after budget conversations have happened.
The process usually takes several months, up to a year.
He had set himself up for failure by defining success as something that doesn't happen at this stage of the sales process. So even though the calls went well and prospects were genuinely interested, he couldn't conclude anything. He had good learnings, useful signals, but no way to say whether the experiment validated his assumption or not.
Fixing the experiment
After this round, he’s now rewriting the experiment to match how sales actually work in this industry.
Instead of "buying intent," the signal is now setting up a follow-up call where at least one additional decision-maker is present. That's still a strong signal, it means the prospect is taking it seriously enough to bring someone else into the conversation. It's a real commitment, just not the final one.
We’re also tightening up the rating scale for the value hypothesis. Instead of leaving "helpful" vague, we’re concretely defining what each number means. What does a two look like versus a four? What behaviours or outcomes would you see at each level? That way, when Sales fills it out, they're measuring the same thing every time.
The question they started with, "Can this sales anomaly feature create enough painkiller perception that leads will buy the whole product?", is still being answered.
But with every learning, we’ll check it against the assumption map and the Impact Map. We’ll prune the tree. And with every pruning, new assumptions will emerge. Then we’ll map those new assumptions, see if we need to experiment with them, and keep going.
Conclusion
This is what I love about discovery work.
Even when you're using frameworks like Impact Mapping, Assumptions Mapping, and structured experiments, you can still fail. The frameworks give you a basis, but the rest is on you to figure out.
Sometimes, like in my coachee Bergen's case, you do it by getting it wrong the first time. But that's the work: to keep going until you gather information you can actually use, and that moves you closer to knowing whether you're building something that matters.
If you’ve been struggling with similar issues and want a helping hand in discovery, reach out - I’m always happy to talk.
—
This article was edited by Diana Bernardo.
Product management insights, delivered to your inbox
Sign up for weekly product insights. No spam.