Using the North Star Metric for daily product decisions - A practical guide for product teams
Stay up to date with the latest insights
“Make sure your work aligns with business goals.”
Product teams hear this all the time. Sounds obvious, right? But if it were that easy, teams wouldn’t keep struggling with it. I see it happen all the time - and it happened to me too in the past!
In my workshops, the North Star Metric (NSM) is one of the methods I use to help teams work on what matters. When used correctly, the NSM connects business goals (like revenue, growth, or retention) with what product teams do in their daily work (such as building features, improving UX, or optimising conversion).
Today, I’ll break down how to use your NSM to make daily product decisions. To make it easier to understand, I’ll include a detailed example that proves the point. By the end, you should be able to replicate this exercise with your team.
Ready?
What a North Star Metric Is - And What It’s Not
The NSM represents the core value your product provides to customers.
Sean Ellis first introduced the concept in growth hacking, and marketers used it to track engagement. Read more about the concept from himself here, or in Chartio's article here, or from Amplitude here.
But it's just as useful for product teams. In this case, not as a revenue metric, but as a way to measure if the product is delivering value.
The problem? A lot of companies get this completely wrong. I’ve worked with many teams, and I keep seeing the same mistakes. If your NSM isn’t working, chances are you’re making one of these mistakes:
They set multiple NSMs:
This happens when teams create separate NSMs for different customer segments (the most typical example is having one for buyers, and another for users). It’s a recipe for confusion, especially when you go one level down and identify the priorities underneath the NSM. Quickly, product teams are arguing over what to optimise instead of working together toward a shared goal. Having multiple NSMs only works when there’s a P&L split, or you have multiple products under one hood with very different teams and value intentions.They think “NSM = Revenue”:
Revenue is a lagging metric, not a leading indicator of whether a product is valuable. If revenue is your North Star, you're tracking the result of your activities, not the drivers that eventually lead to revenue.They invert the order:
A solid NSM comes from a deep understanding of the value you create for your customers, not from picking a metric first and bending reality to fit it. If you do this, you're missing to realise what actually matters to customers.They furiously map everything as Input Metrics:
Theoretically, everything is an input. But not every input will have a significant effect on the big fat metric (= NSM) that you are trying to move.
Ok, I can already hear some of you thinking, "Yeah, we know what NOT to do but... how do you do it right?”
Let’s get into that.
The Connection Between Business Goals and Product Work
The purpose of a NSM is to connect high-level business goals with daily product decisions.
Let’s introduce our example: Imagine you run a subscription service for toy boxes. Every month, parents get a curated toy box for their toddlers. They can either fully return it or keep toys from it for an extra fee. The business makes money through:
Monthly subscriptions for the service
Customers choosing to keep toys
An optional pick-up service for the returned boxes
Let's say leadership wants to grow revenue. That's great - but revenue isn't a North Star Metric. It's just the result. A better NSM in this case would be "Monthly boxes with enjoyable toys delivered on time”. Here’s why:
It captures value: Parents stay subscribed when their kids love the toys.
It aligns with business growth: More enjoyable boxes = more subscriptions and fewer cancellations.
It is actionable: The product team can directly influence the metric by improving certain parameters, like toy selection, packaging, and logistics.
This sets us in the right direction, but it still doesn’t tell us exactly what to do. For that, we’re going to break down our NSM into a metrics tree.
Breaking Down the NSM: The Metrics Tree
The metrics tree is the connecting piece that helps us visualise how day-to-day product decisions impact the NSM.
Here’s a representation of the metrics tree for our toy subscription example (click to expand):
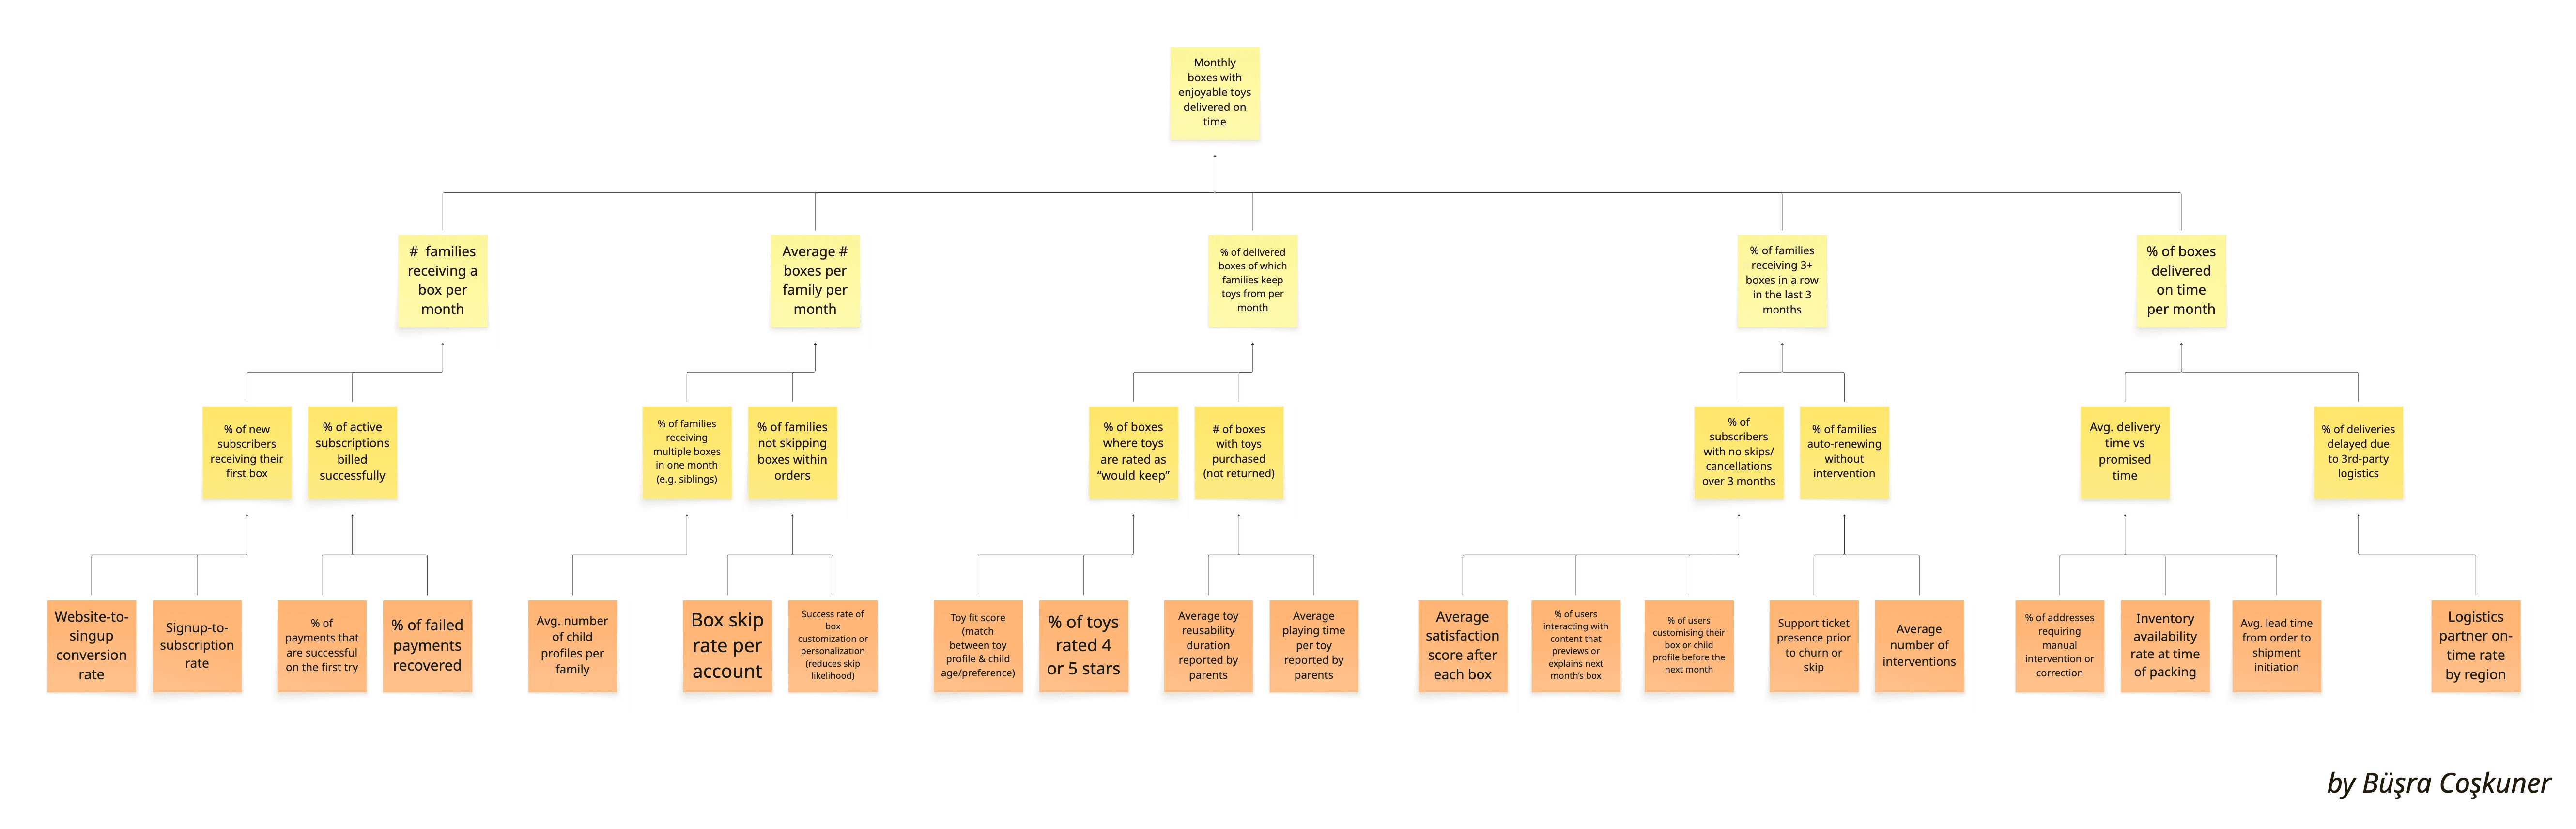
Image: North Star Metric Tree Example by Büşra Coşkuner
Let's look at the upper part of the tree first.
At the top, we have our NSM "Monthly boxes with enjoyable toys delivered on time". Underneath, we break it into contributing factors, such as:
# families receiving a box per month
Average # boxes per family per month
% of delivered boxes of which families keep toys from per month
% of families receiving 3+ boxes in a row in the last 3 months
% of boxes delivered on time per month
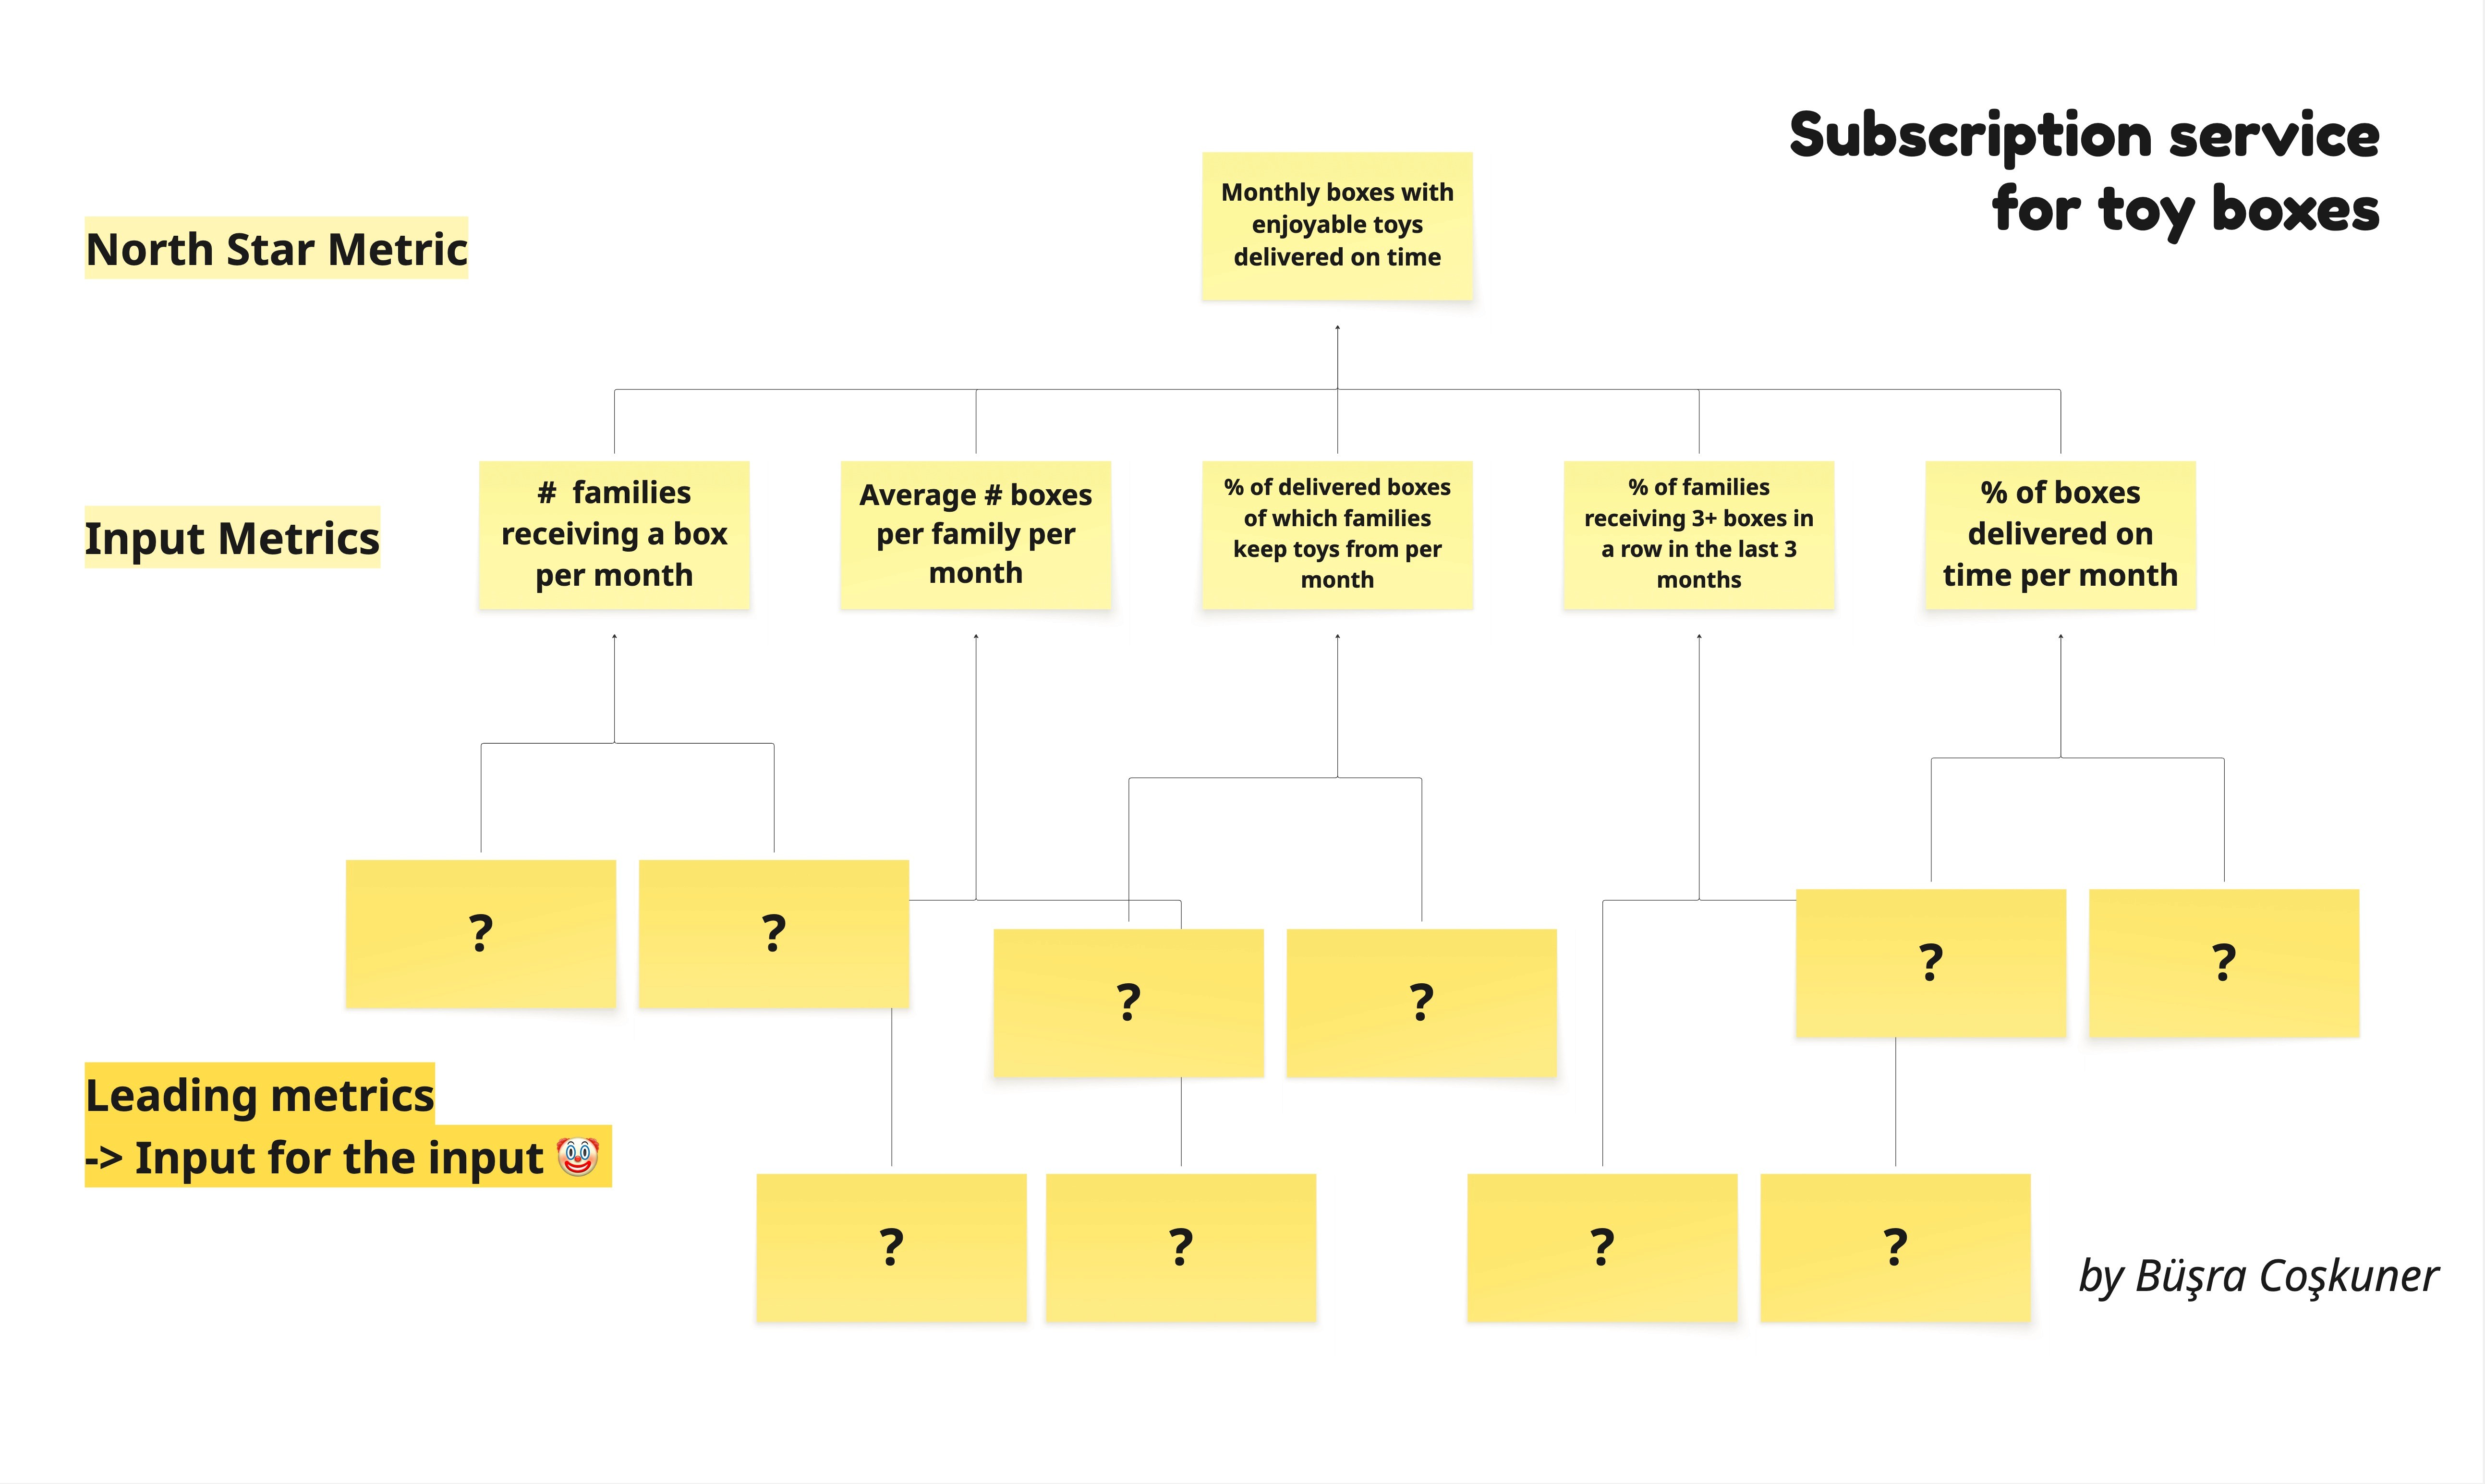
Image: North Star Metric and Input Metrics Example by Büşra Coşkuner
How did I come up with these? I asked myself the questions: “What will contribute to the sustainable growth of this metric and eventually revenue”. While there are different angles to answering this question, I typically try to find metrics that represent breadth, depth, frequency and efficiency.
Breadth = Driving Acquisition.
Depth = Driving Adoption and Activation.
Frequency = Driving Engagement and Retention.
Efficiency = Optimising unit economics for a sustainable, healthy business.
Alright, let’s continue.
In a next step, we break down each of these factors. For the first one, “# families receiving a box per month”, we identify two factors driving it:
% of new subscribers receiving their first box
% of active subscriptions billed successfully
We do the exercise of breaking them down again. For “% of new subscribers receiving their first box” we realise that two input metrics drive it:
Website-to-signup conversion rate
Signup-to-subscription rate
We do the same for all the factors and end up with plenty of inputs the product team can act on, each one laddering up to the North Star Metric.
NSM Helps You Decide In 2 Ways
Once you build your NSM tree, you can use it in two ways: starting from data or starting from strategic goals.
1. Metrics-Guided Approach
In this case, we start with the numbers.
You can look at the metrics tree to find the weak spots in the input metrics and then figure out how to fix them.
Let’s say your analytics show that only 60% of boxes are delivered on time. Looking further, you discover that the main issue is with a specific logistics partner in one region. Now you know what to optimise (not in vague terms like “improve delivery”) but in a targeted, measurable way.
This allows teams to stop guessing and start tackling what's actually getting in the way of delivering value.
2. Initiatives-Guided Approach
Priorities can be given top-down by leadership.
Let’s say that, in our example, leadership had set the following goals: “reduce return costs” or “improve retention in new families.”
Using the NSM tree, you can work backwards from those initiatives and find the metrics that matter.
Say the goal is to reduce returns. You look at the NSM tree and notice that toys rated under 4 stars have a much higher return rate. That connects poor ratings to increased return costs. The team might then decide to improve toy quality or adjust sourcing.
This approach makes top-down goals more actionable and gives Product a seat at the strategy table.
Important Side Note
Note that either approach should not be too metric-fixated.
Metrics can inform us where the dips are and where we can expect connections in the form of “When we change this part of our product, that part might see a change, too, so be careful here.” But:
a) metrics can never give you the full picture of what’s happening and especially not WHY it’s happening. So make sure to get qualitative input as well before grounding all of your decisions on the metrics tree.
b) these metrics can still be too abstract, too high-level when you are trying to iterate on a small part of the product. So you will probably have to break your target metric from the NSM tree further down into smaller leading indicators.
Don’t forget Goodhart’s law: "When a measure becomes a target, it ceases to be a good measure".
Therefore, make sure to fixate on the intention - measured by that metric.
AND like a tree in the nature, your metrics tree is a living document. Prune it, let it grow, let it drop some metrics, break some metrics further down, group other metrics, prune it again, etc. Tree should surface what's important at the moment, and this will change with your strategy deployment and the learnings from customer feedback.
Conclusion
Your NSM should do one thing well: connect strategy to daily product work.
It’s the one thing that ensures product teams aren’t just building features for the sake of it, but actually moving the business in the right direction. Teams can transform from scattered feature factories to focused value creators just by getting this right.
How does your team use NSM? Is it actually guiding decisions, or is it just a nice metric on a slide deck? Drop me an email. I'd love to hear your NSM stories!
—
This article was edited by Diana Bernardo.
Product management insights, delivered to your inbox
Sign up for weekly product insights. No spam.