Beyond AARRR: Map your product’s actual Success Engine
Stay up to date with the latest insights
Everyone in Product Management has sounded like a pirate at some point.
“AARRR!” — we said with our best pirate voice, convinced this model would finally make our work easier.
And to be fair, it helped. The Pirate Metrics (Acquisition, Activation, Retention, Referral, Revenue) gave us a shared language for thinking about user journeys and connecting product behaviour to business performance.
It’s a great framework. For marketing teams who usually work with funnels, it works like a charm.
It’s very useful for us product folks, too. But for product work, it has a big flaw: it assumes user journeys are linear when, in reality, they almost never are. Users zig-zag, skip steps, and loop back. If you’ve ever tried to apply the Pirate Metrics as-is to your product, you’ve likely felt the friction:
Roadmaps anchored to the wrong priorities
Teams chasing non-existent growth levers
Funnel mathematics that don’t reflect the business model
Funnels try to simplify reality but they can end up misleading you. We need a new approach. My advice: stop treating AARRR as a rigid funnel and start thinking of it as a map of real dynamics.
How? That’s exactly what we’ll explore in this article.
From funnel to factory
The AARRR funnel originated with Dave McClure, who wanted a simple way to map how users move from awareness to revenue. It became the universal language of startups because it connected product behavior to business growth in five clear steps:
Acquisition: How users find you
Activation: Their first real taste of value
Retention: What keeps them coming back
Referral: Loops that fuel organic growth
Revenue: How the business makes money
You can learn more about it through his original slide deck and his 5 minute video. There is also a great article about it on the Productplan blog (no affiliate, no sponsoring, just a good article).
But by now, we know this doesn’t reflect reality. So what’s better?
Ash Maurya tried to solve this by taking the model one step further. He created the “Customer Factory” concept, reframing AARRR as a system of dynamics, not a linear flow:
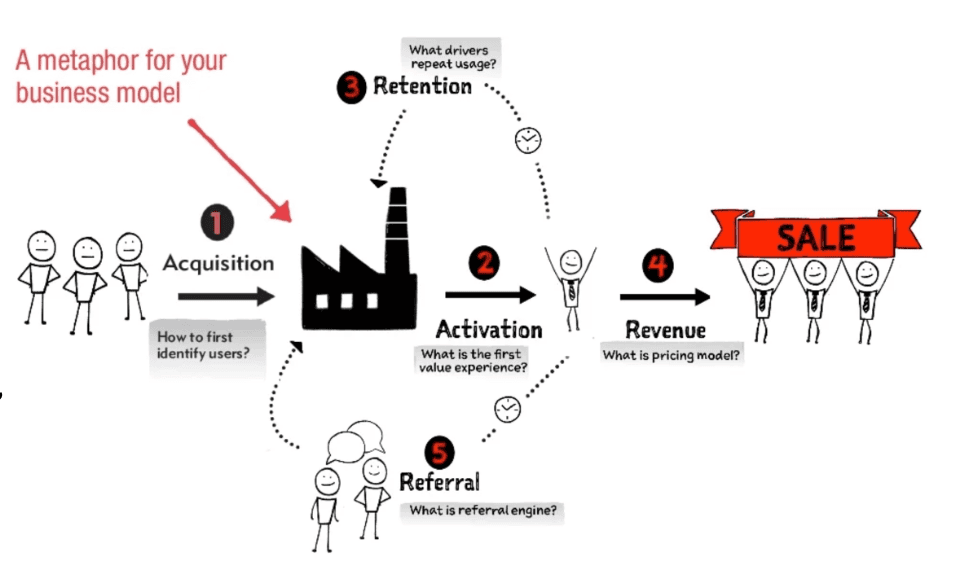
Instead of imagining users going through standard stages, the Customer Factory treats the product like a machine that turns “unaware visitors” into “happy customers.” The same AARRR steps remain, but now they interact in loops and cycles rather than straight lines.
A big improvement! And it helps a lot to understand the dynamics better.
But it’s still generic.
So how do you build something practical that reflects your product’s messy reality? That’s where the Success Engine comes in.
Enter the Success Engine
After working with dozens of teams, I created the Success Engine, deriving from one simple principle: stop trying to squeeze your product into someone else’s funnel. Instead, map the real loops and dependencies that make your business work.
The name takes inspiration from the growth engines in “The Lean Startup”:
Paid engine: activities that drive acquisition
Sticky engine: features that drive retention
Viral engine: loops that generate referrals
The Success Engine of your product is the diagram that shows how those forces interact, and where your biggest opportunities lie. It reflects how your business model actually works, and how that model drives product and business success.
This exercise turns an abstract funnel into an actionable map. You can see dependencies, spot bottlenecks, align teams on what matters, and uncover the unique levers that move your product forward. Again, note that word: your product, not a generic, standard one.
The best way to understand this is through real-world examples, so let’s look at some.
One size doesn’t fit all: Real-world examples
Every product has its own dynamics. Even when two companies share the same business model, their diagrams rarely look the same. Let’s use LinkedIn, Miro, and Airbnb to see how different these engines can be.

LinkedIn starts like any other freemium product: free experience first, monetization later. But the actual flow breaks the AARRR funnel assumption immediately:
Referrals happen early: LinkedIn’s experience depends on connections. Users invite others to connect immediately, whether they’re already on the platform or not, so the loop starts almost at sign-up.
Retention doesn’t necessarily lead to revenue: most users stay in the free plan forever.
Payment requires reactivation: For example, Sales Navigator, one of LinkedIn’s premium plans, feels like an entirely different product, requiring a second activation moment. Any other paid tier comes with its own experience that is different from the free version. The paid plans have to prove to the payer that they are worth it.
Premium referrals are rare: Users don’t refer paid plans unless they’ve extracted significant value because those plans are expensive and only make sense for heavy, successful users.
Miro
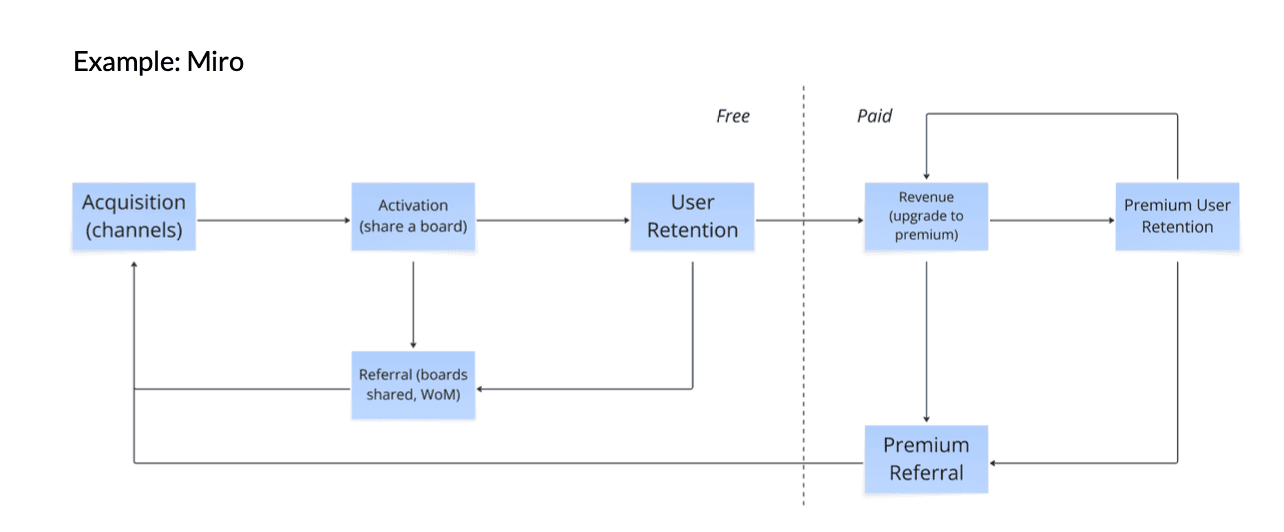
Miro offers a freemium plan, like LinkedIn, but the flow is different:
Activation drives acquisition: The “aha” moment happens when users share a board and invite collaborators. This step isn’t just activation, it also fuels acquisition through built-in network effects.
Monetisation builds on the core experience: Unlike LinkedIn, where premium feels like a separate product, Miro’s paid tiers give the user access to advanced features they already know they need. No need for a second activation.
Premium referrals are easier: Because the experience doesn’t change significantly after upgrade, users feel compelled to recommend paid plans to others.
Airbnb

Airbnb’s engine breaks the AARRR flow in three key ways:
Payment comes before experience: users book and pay before the stay, which means that revenue comes before retention.
Retention is hard: retention depends on a positive end-to-end experience, and that experience lives mostly outside the product.
Supply quality is the hidden lever: if there are no great hosts, there are no happy guests, and the referral engine breaks. Airbnb’s growth depends as much on supporting hosts as on optimizing the traveler experience.
These examples show that there is no universal order. Your AARRR might look like ARAAR, ARRAR, or even have extra As and Rs. And might reveal the dynamics between different target groups. The only way to discover it is to map it.
How to use the Success Engine at your organisation
Think of your product’s Success Engine as a tool to drive decisions.
Here are three ways you can use it:
1. Map your current dynamics
Start by sketching how users really move through your product. Use AARRR as a starting point, then add the real paths and loops. Sometimes it's hard to identify the flows, so here are a few questions to guide you: When do referrals happen? Does revenue come before or after activation? What triggers retention? Do you need to activate twice? Who drives whom?
If the results look messy, good! It means you’re capturing reality.
2. Identify gaps and model the future
Once you've established your current dynamics, it’s time to think about the ideal state. To explore the gap between these two, ask yourself questions such as: Where are users dropping off? Which engine (paid, sticky, viral) underperforms? Which loops don’t exist but should?
As an example, a partner therapy platform I worked with had no referral system. Mapping the engine made that gap obvious and gave the CEO a clear growth lever to prioritise. This led us to discuss how the platform would look like if Retention was before Revenue, if that’s realistic, if Activation really needs to happen twice, and so much more.
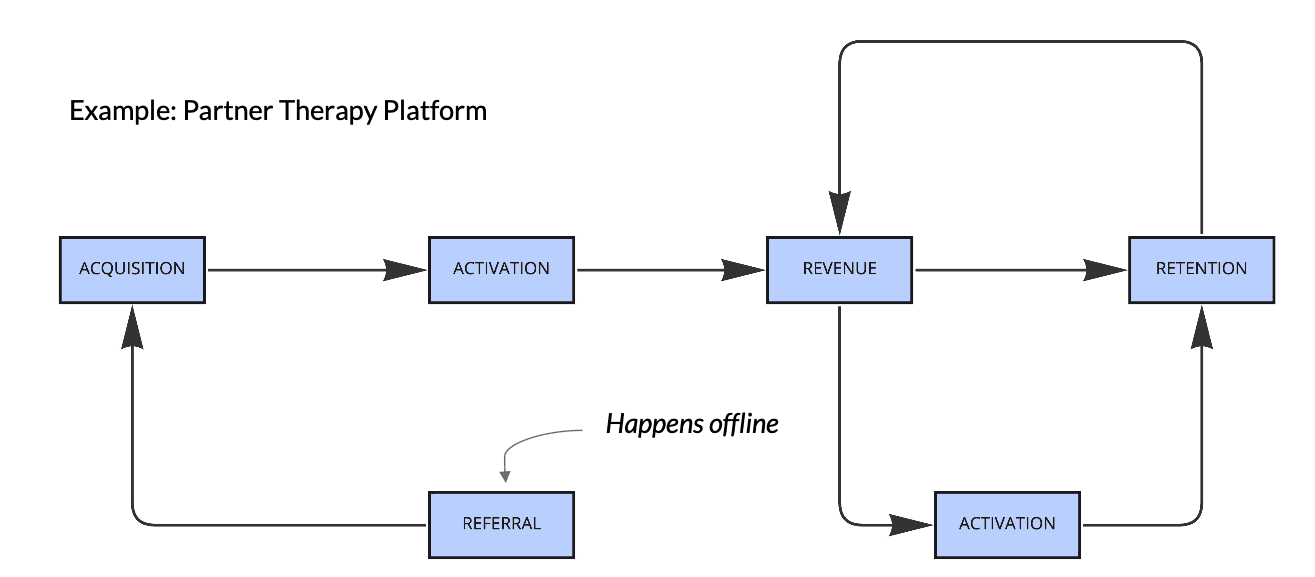
Based on your two models (current and ideal), add numbers to the diagram. This allows you to ask specific questions that will guide decisions. For example: if activation improves by 20% , what happens to revenue? Or if referral doubles, how does that impact acquisition?
This step turns the Success Engine into a strategic planning tool and even informs your roadmap. For example, if activation is the weakest link, you’ve just found your next priority.
3. Make it measurable
Models are great for clarity, but if you want to act on them, you need to translate abstract steps into observable signals. There are two levels of measurement you can combine:
Conversion metrics across stages – this shows you the big picture:
What percentage of acquired users activate?
How many activated users retain?
How many retained users convert to paid?
Step-specific success signals – this shows what success looks like at each stage.
Vague goals are not enough, you need specific, measurable behaviours. For example, on Gumtree, a classifieds website in the UK, it could look like this:Acquisition = a visit to the site
Activation = user views 3+ listings and sends a message
Referral = user shares a listing via social buttons
The first layer shows the overall health of your engine, while the second helps you pinpoint where to act. Without clear definitions, your teams act purely on gut feeling. But with them, you can track progress over time, test hypotheses (for example, “What if activation increases by 20%?”), and connect product work to business impact.
This is the difference between saying “activation improved” and seeing the compounding effect on the product’s performance.
Personal experience: Doodle’s Success Engine
When I worked at Doodle, I launched (and killed) several new products into Doodle's scheduling ecosystem. Two of the survivors are Doodle 1:1 and Bookable Calendar (now Booking Pages). They look different today, so in this example you get some nostalgia.
Back in those days, we in Product Management were figuring out this PLG-thing.
It was a growth discipline and new in product management. Today with all the PLG expert advice, it is obvious what your levers are and what matters most. But at the time, any of these levers were in our guts and we didn’t have a formal way of analysing them.
So here’s what we did: My CPO back then - Jack Berglund - and I used the Customer Factory to map 1:1 and Bookable Calendars, and cross-checked our growth engine. We realised that Activation and Referral were literally the core of our growth engine. Doodle polls have always had strong network effects (which we counted under “Referral”) but seeing the massive impact of the sharing motion in Activation and Referral, we made sure to:
a) Keep the sharing experience smooth, no matter what
b) Keep a close eye on the shared-to-created conversion
c) Find the Activation moment (aka the “Aha-Moment”) in the intersection of creating and sharing a calendar and events booked through invitees.
In a second iteration of the Customer Factory, we realised that for Retention, the booking experience was more important than the creation experience for Bookable Calendars, whereas it was equally important for 1:1s.
Below, you can see how we mapped Doodle 1:1 (yes the experience has changed greatly over the years). We also derived some first rough metrics to experiment with from that map.
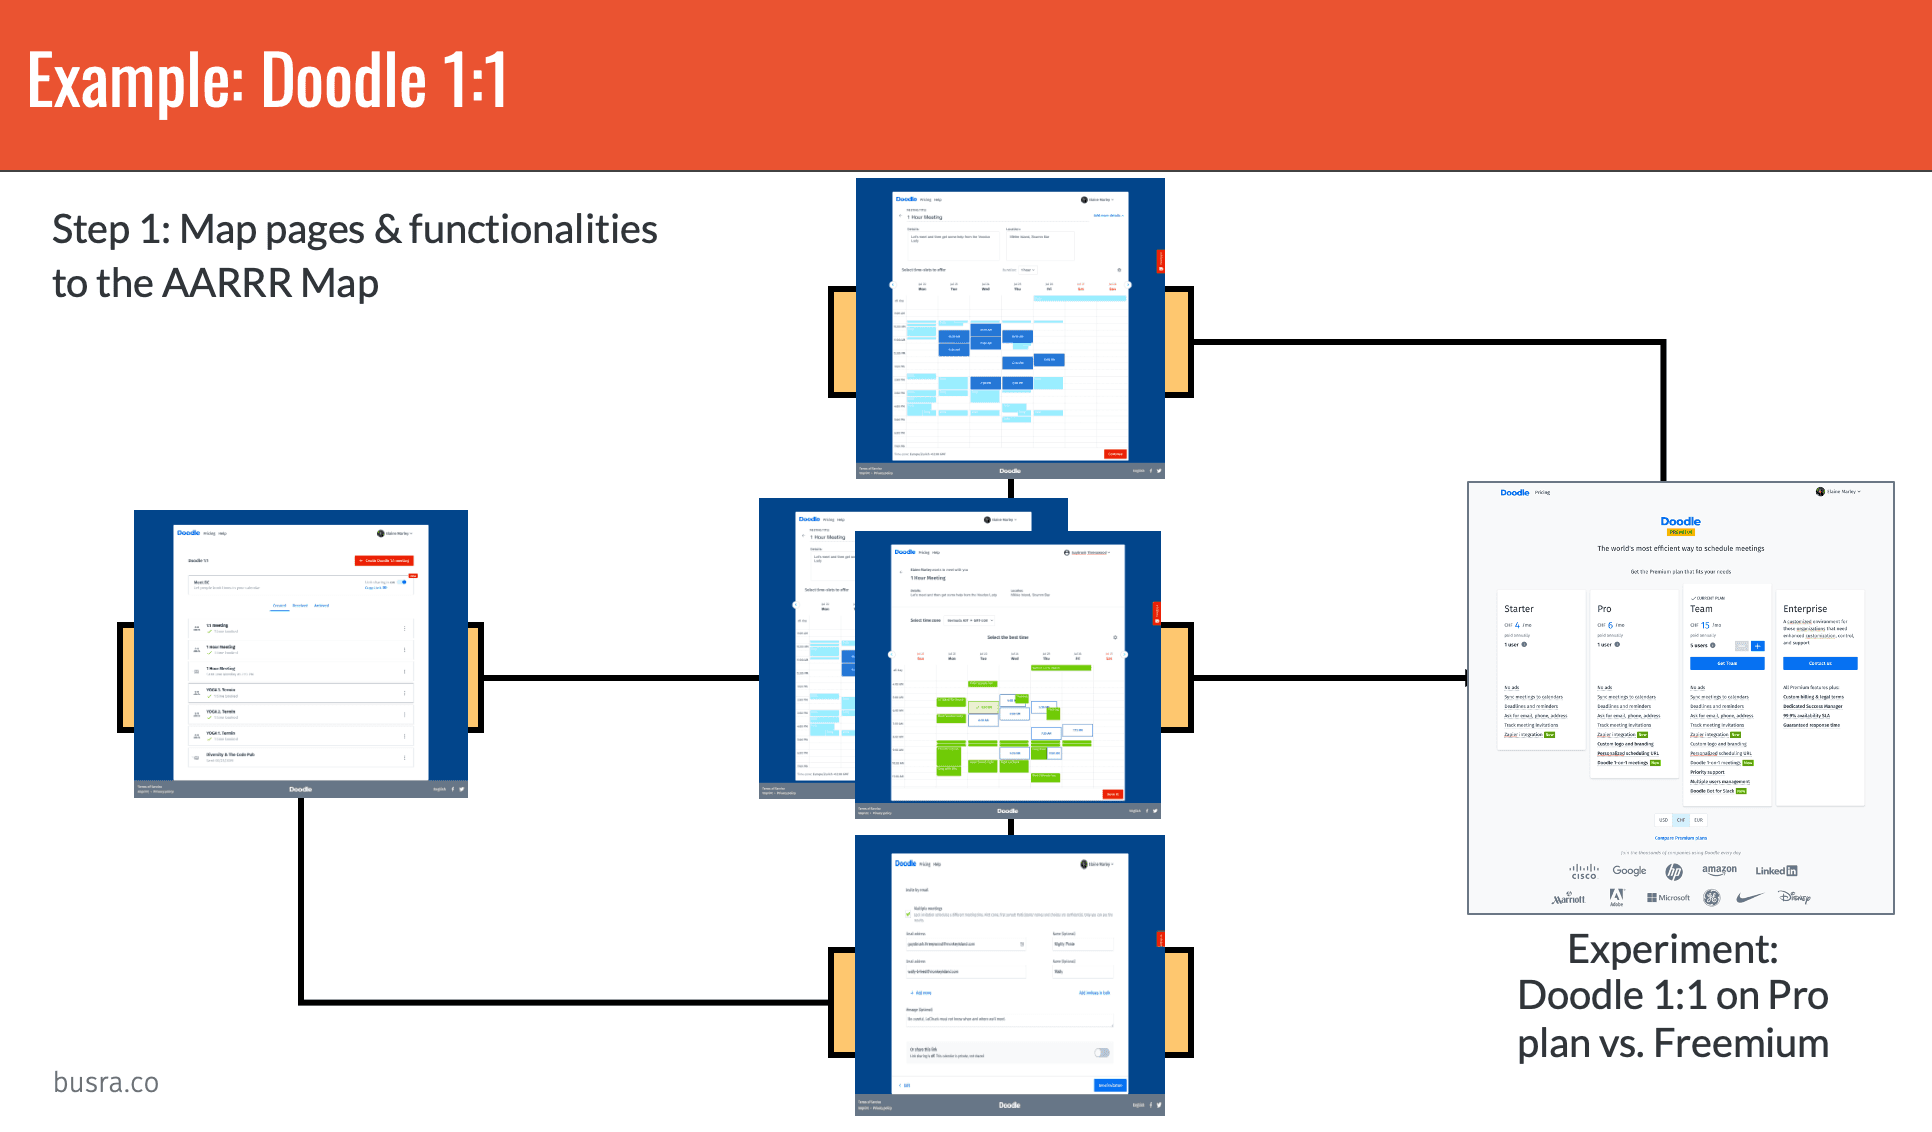
Doodle 1:1 started as a free to use scheduling functionality in the Doodle scheduling suite. The plan was to monetise this as part of our paid premium tiers.
As part of the conversations between me and our CPO, I had modelled three different Success Engines that would reflect each option that we had on the table.
Here are the Success Engines.
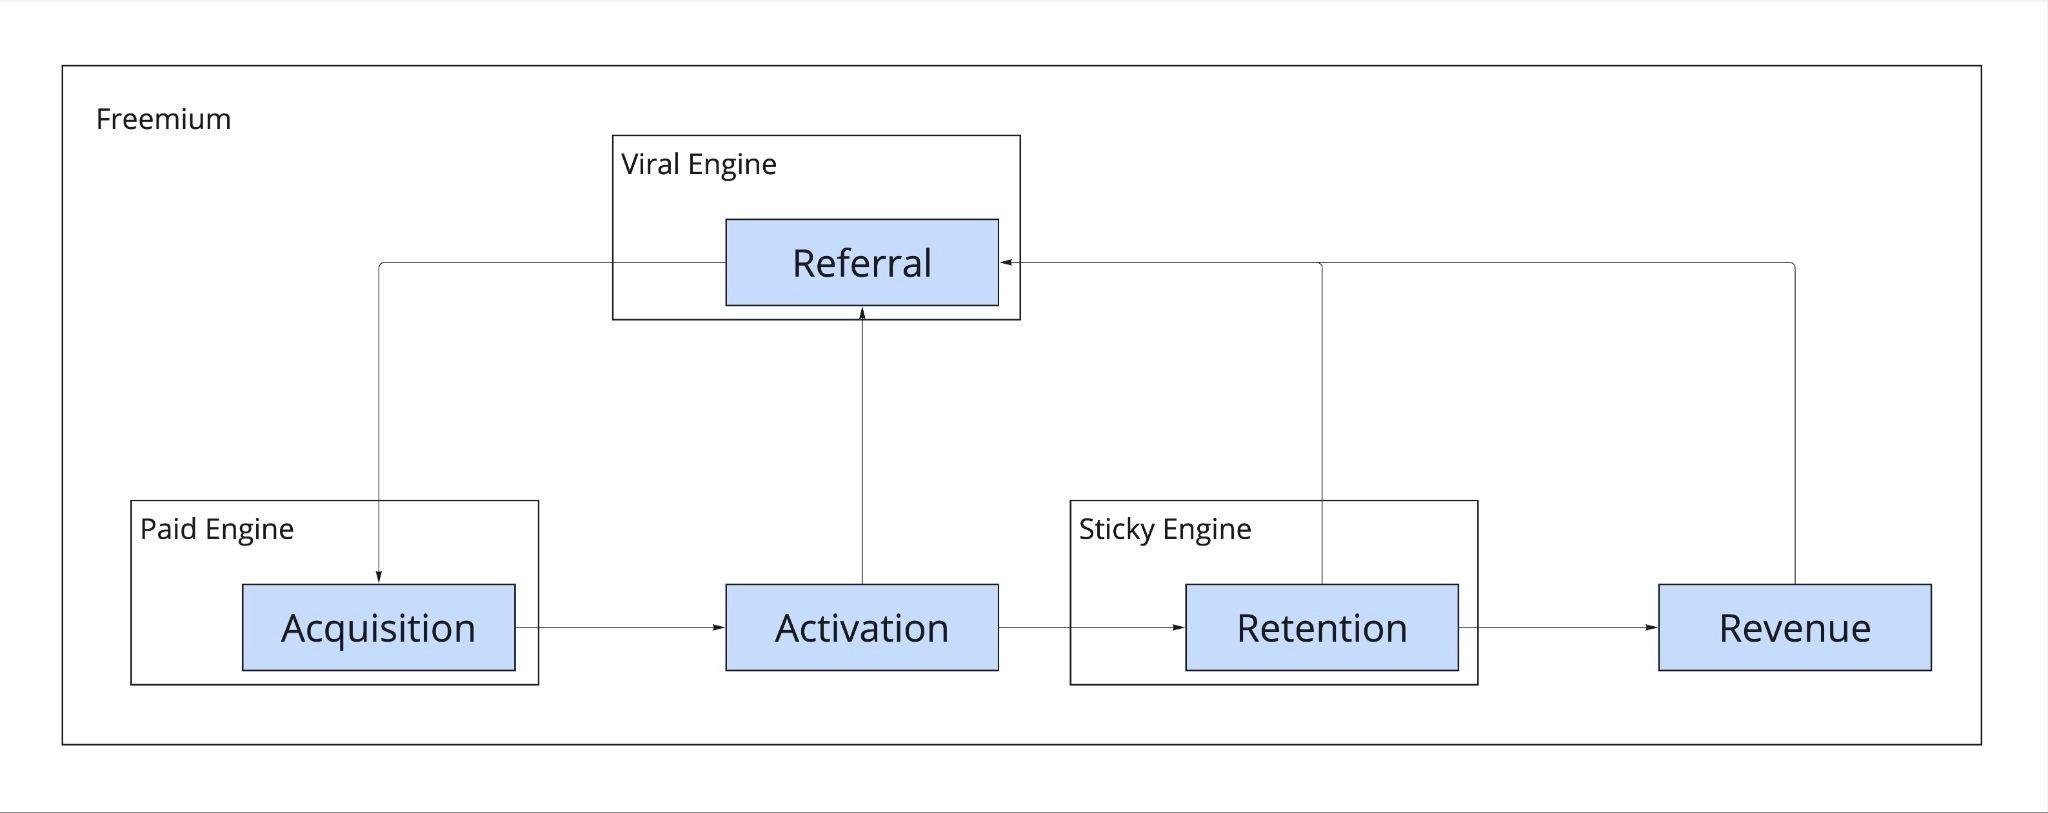
You can see that the bet in Freemium is to give Free users a lot of value to keep them around, and find levers that upsell them to Premium. We could break this model down even further and show the exact dynamics between Retention and Revenue.

In the Pay-to-Use business model, we would cut free usage entirely and only give paying customers access to Doodle 1:1, which in return would heavily rely on proper Activation without even trying the tool.

In the Free use case, the Revenue would rely on Ads. Meaning: we would create another surface to have more places to show ads. In this model, Acquisition and Retention would drive Ads revenue.
This way, we could compare what each business model's growth system would look like, and could make better decisions on what to test and how to monetise Doodle 1:1.
Limitations
With one client, I'm building a 10-company portfolio strategy. When I started working with them, I wanted to understand their dynamics better. I tried to map the Success Engine of the portfolio as a system so that I could see which company serves which part of the engine. Each of those 10 companies serves multiple different target groups, one of them being clearly B2C and the other nine being B2B and B2B2C, the majority of them being a mix. You can imagine that it was too complex to fit it into a couple of Success Engines…
Final thoughts
The AARRR funnel is a useful starting point, but real life doesn’t happen in straight lines.
Users experience your product through loops and interactions that are unique to your business model. Your Success Engine reflects that messy reality, and allows you to fix the gaps that hinder growth, while doubling down on what works.
So here’s my challenge to you: take a sheet of paper (or open a Miro board), and write down the five AARRR steps. Then draw the loops and arrows that reflect how your product really works.
I’d love to see your diagrams, feel free to share them with me!
—
This article was edited by Diana Bernardo.
Product management insights, delivered to your inbox
Sign up for weekly product insights. No spam.