How to find leading indicators: Journey Mapping and Driver Trees
Stay up to date with the latest insights

Christina Wodtke suggested I should write about leading vs. lagging indicators and my ways of finding leading indicators. Thanks for pushing me, Christina 👋
So, here I am, trying to be as little nerdy as I can while sharing my approach.
Imagine that you’d gain access to the Flux Capacitor of Back to the Future. (Ok I failed already regarding the nerdy aspect. Anyway…)
You could go back in time and rewatch every step you took last quarter. You'd see exactly where things went right and where they went wrong. The only problem: you couldn’t change any of it.
That’s exactly the limitation of lagging indicators. They tell you what happened in the past but, by the time you can see it, it's too late to do anything about it.
What you actually want is the next best thing to a time machine: a signal early enough in the journey that you can still act on it, before the outcome is decided. That's a leading indicator.
Most people can define both terms without much trouble. The much harder, much more useful question is: how do you find them? I have some suggestions.
Lagging vs. leading indicators
Lagging indicators reflect the impact of past actions. They're usually easy to measure, but hard to influence directly, and they're the ones you'll find in most reporting decks and business KPIs. Revenue, retention rate, monthly active users, conversion rate - they’re all lagging.
Leading indicators predict future performance. They're more actionable, more useful for product teams day to day, and usually sit earlier in the user journey. Click-through rate, DAU/MAU ratio, signup rate, or first feature usage, for example.
Simple, right? Let’s make it more complicated.
Nothing is permanently leading or permanently lagging. The same metric can be either, depending on what you're comparing it to.
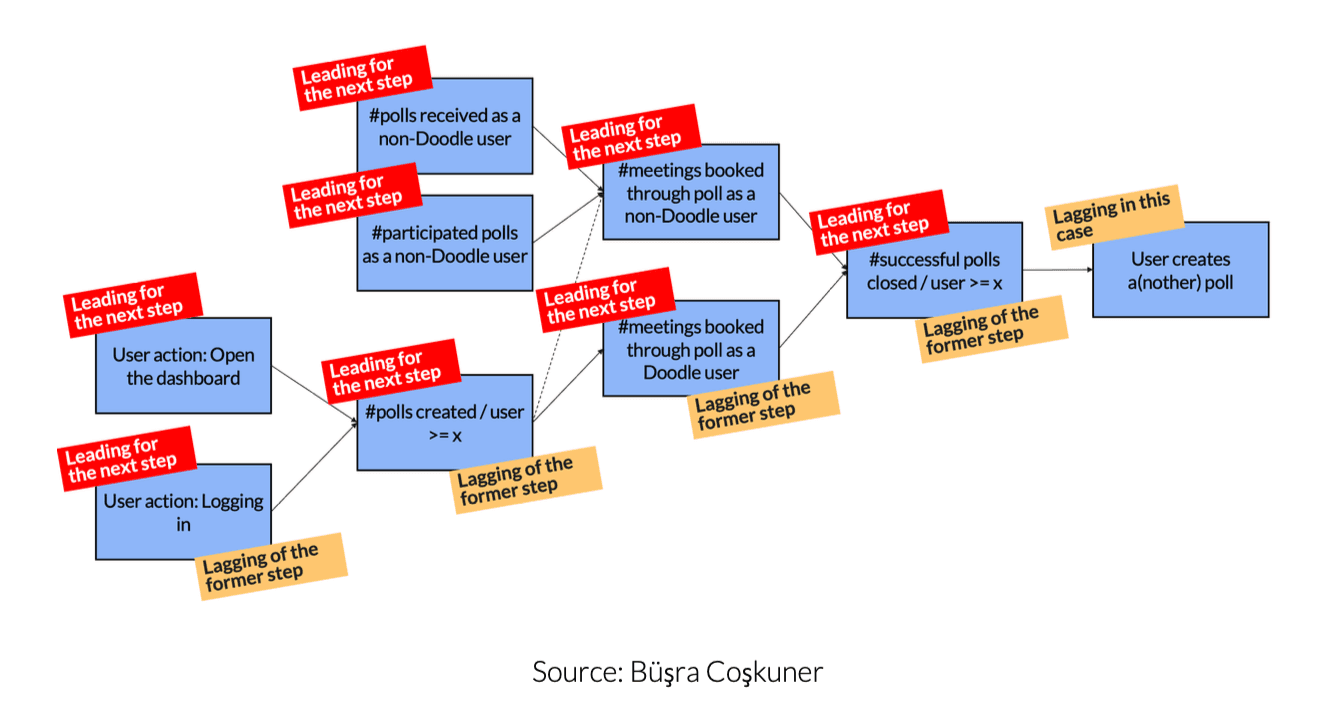
Take Doodle, as an example. Logging in leads to creating a poll, that's obvious. But creating a poll is also lagging, relative to logging in. At the same time, it's leading, relative to sharing that poll with others. Sharing a poll is lagging, relative to creating it, but leading, relative to meetings actually getting booked through it. And a booked meeting is lagging relative to sharing, but leading relative to the poll finally being closed.
Every step in that chain is both a lagging indicator of the step before it, and a leading indicator of the step after it.

Sometimes, it’s that obvious and simple. Other times, the journey is so much more complex that figuring out whether a metric is leading or lagging requires a lot more context and analysis.
That's relativity within one journey. But the same metric can change from leading to lagging across completely different journeys too, just by changing industries. Think about "conversion." If you're selling shoes, someone can discover a product, buy it and generate revenue within a few minutes. In that context, conversion behaves almost like a leading indicator of revenue.
Selling a car is different. Or a flat. Or enterprise software. The purchase decision might take weeks or months. By the time conversion finally happens, most of the journey is already behind, making the same metric behave much more like a lagging indicator.
Two practical ways to find your leading indicators
Sometimes the relationship between two metrics is a no-brainer. You can’t share a poll you haven’t created yet, for example. “Thank you, Mrs. Obvious.” I know it’s simple logic, but it’s important to name it because, sometimes, it really is that simple.
Unfortunately, most of the time, it’s a lot more complex than that.
So you need a systematic way of discovering which behaviours predict the outcome you’re trying to influence. For that, I use two approaches, and I'll walk you through both using the same example: a typical e-commerce store.
Method One: Map the Journey & Find the Turning Points
Find leading indicators in 5 steps:
Define your conversion point
Map the happy path, then the unhappy paths
Identify the turning points
What is the Job-to-Be-Done of each turning point?
What is the metric that measures that success?
Let’s go into the details.
Step 1: Define your conversion point
Before anything else, you need to know what you're working towards, and that depends entirely on your business.
For our e-commerce store, this part is easy: the conversion point is the sale itself. But it isn't always this obvious. Take a pension fund's blog, for instance, whose entire reason for existing is to inform readers until they're ready to convert by opening a pension account. There, the sale isn't the conversion point at all, opening the account is.
So don't skip this step just because it feels obvious for your case, it won't always be.
Step 2: Map the happy path, then the unhappy paths
Once you know your conversion point, map the journey towards it. Start with the happy path, then the most critical unhappy paths.
For our store, the happy path looks roughly like this: someone searches or browses, lands on a product detail page, adds an item to their basket, goes to checkout, and completes the purchase.
Step 3: Identify the turning points
Now look for what I call “turning points”. These are the one or two steps that, if they break, the user will definitely not reach the conversion point.
For this journey, that's the search results page and the product detail page. If someone can't find relevant items through search, or the product page doesn't give them enough information to decide, they will never make that purchase.
Step 4: What is the Job-to-Be-Done of each turning point?
The job of the search results page is to show relevant items, fast. The job of the product detail page is to give someone enough information to decide. Once you know the job, you know what success on that step looks like, and what action would reflect that success.
Success on search shows up as a click. Success on the product detail page shows up as adding the item to the basket.
Step 5: What is the metric that measures that success?
The success of that step is your leading indicator. So, click-through rate on the search results page is your leading indicator for search. Add-to-cart rate is your leading indicator for the product detail page. Both are proven, classic leading indicators of the sale that happens further down the line, and now you know exactly why: you didn't guess them, you traced them back from the job each step was actually meant to do.
Mapping the whole journey this way, and finding these turning points, isn't just how you find leading indicators. It's how you prove that any product can be quantified, even the ones that don't look like they have an obvious funnel at all. But that deserves its own article.
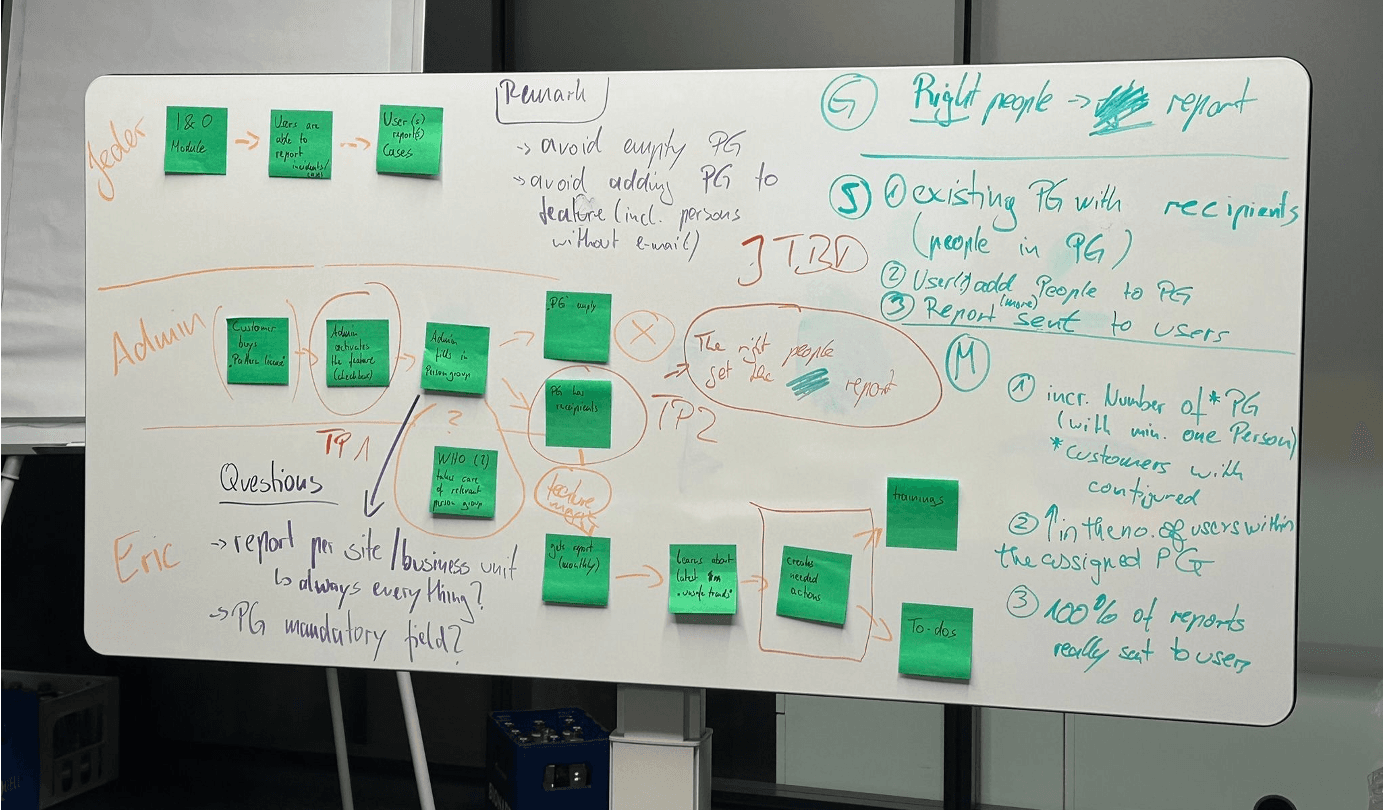
And yes, this works in B2B, too. Just ask the product team at Quentic, who gave me their permission to show you the result of our Success Metrics That Matter workshop:
Method Two: Build Driver Trees
Journey mapping works well when your product has a clear, linear path. But sometimes the relationship you're after isn't a step in a journey. That’s when driver trees come in handy - and they come in two types:
Type 1: Mathematical
Back to our e-commerce store:
Profit depends on revenue and cost → Revenue depends on average order value and number of purchases → Number of purchases depends on conversion rate and traffic.
None of that is a guess, it's true by definition. Whenever the relationship between two metrics is mathematical like this, a driver tree is a very powerful way of finding your upstream metrics for free, just by doing the maths.
Type 2: Sense-making
Often, you're trying to understand relationships that aren't mathematical at all: does completing onboarding within five minutes increase retention? Does inviting three teammates predict long-term activation? Does using a particular feature in the first week reduce churn?
None of these answers comes in a formula.
Instead, you can find them in your analytics - or even in an LLM running analysis for you, and testing which metrics actually correlate most strongly with the lagging indicator you're trying to influence, and in what order they sit relative to each other.
The metrics with the strongest correlation are your real leading indicators. The ones with only a slight correlation are still actionable, they're just not the lever that will move the number you actually care about.
The Takeaway
Every metric on your user journey is actionable, and you can always try to move it. But actionable is not the same as leading. Only a handful of steps are big enough levers to actually move your lagging indicator. The rest are worth improving, sure, but improving them won't move the number you actually care about.
So before you call something a leading indicator, ask yourself which one it really is. Chances are, you've got a list of actionable metrics, and a much shorter list of actual leading ones.
The good news is that finding your real leading indicators doesn’t require a data science team or a three-month project. You can start tomorrow. Pick the one lagging indicator your team cares about most and agree on what conversion actually means for your product. Then grab a whiteboard, map the happy path towards it, and mark the one or two steps where users drop out for good. For each of those turning points, ask what job it has to do and which user action shows that it did it. That action is your first candidate for a leading indicator. If your product doesn’t follow a neat path, sketch a driver tree instead: do the maths where the relationships are mathematical, and check your analytics where they aren’t. By the end of the session, you won’t have a perfect answer, but you’ll have a short list of metrics you can test, and a clear reason for every one of them.
Would you like a helping hand to guide your team through this? Get in touch like Quentic did and let me help you with my workshop or with my coaching guidance.
Product management insights, delivered to your inbox
Sign up for weekly product insights. No spam.