My proven success-metric framework
Stay up to date with the latest insights
Ever had a chat with a product co-worker and heard, “Not everything deserves a metric. It’s not even possible to measure everything”?
To be honest, I hear it all the time. But here’s a little secret: there’s an easy way to start measuring and identifying success metrics.
Here’s the simplest way to begin - even in B2B:
1. Map out the User Journey
Every user (or AI) takes their paths through your product. It's not linear. It's the paths and forks and loops through your product.
Plot them. Visualise them. You can start with a backbone like in a user journey map and later on visualise different paths.
That's the easiest start for quantification.
Why? Because every step from A to B in your user journey is a (micro) conversion. Tracking these steps helps you understand where your users are dropping off, how long it takes them to get from A to B, and this way see where potential for growth might be.
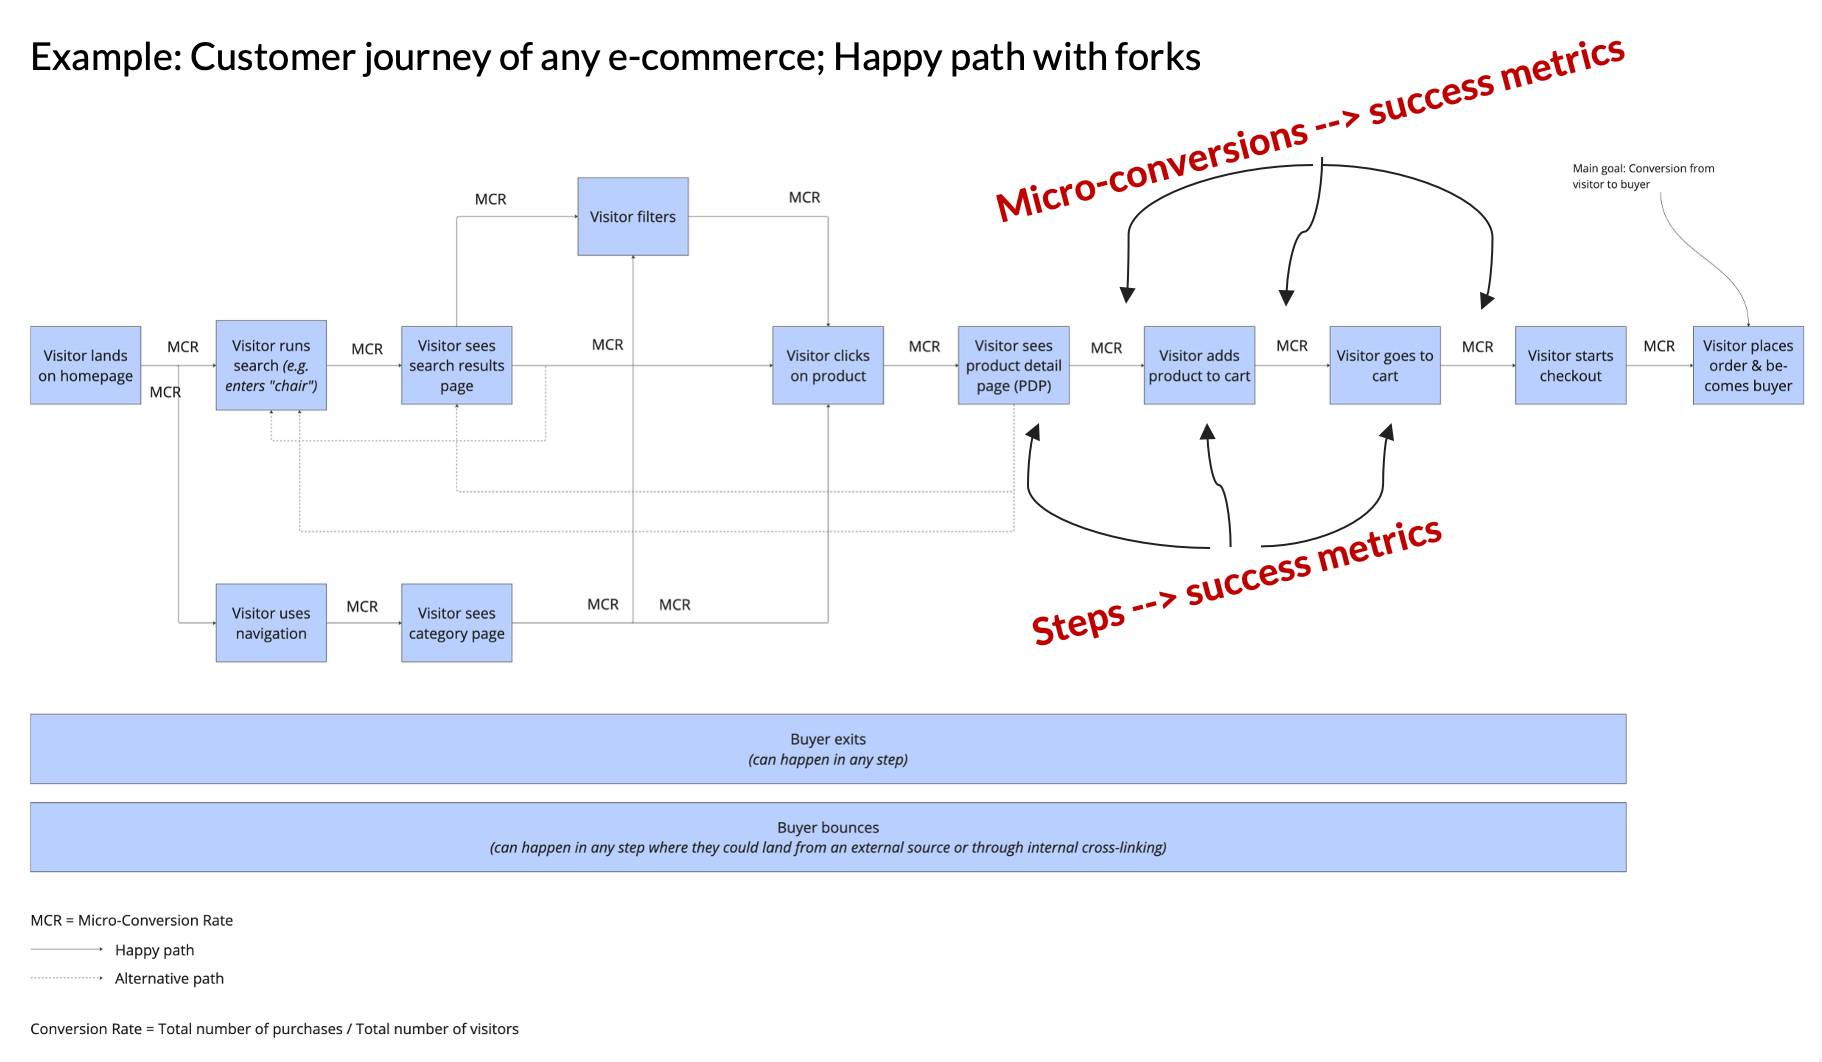 Example: E-Commerce |
2. Identify the most important steps
Think of these steps as the main stepping stone in your user's journey. They’re absolutely crucial for both the user and the business.
Why? It will show you what really matters to both parties.
How do you find them? By discussing and finding what I call "the turning point step". Which 1-2 steps in the user journey are so critical that when these don't work you'll lose the user down the road?
Define those steps's Jobs-to-be-Done (JTBD) and the metrics that would measure the JTBD properly.
3. Track these paths with Analytics
Once you know what steps and paths to watch, use your analytics to keep an eye on them. This is like having a GPS for your user journey.
Why? It helps you make data-informed decisions, boost conversion rates and discover gaps in the user journey.
How? Measure the micro-conversions and time to micro-conversion between steps, define JTBDs for the main steps and paths, and then define metrics that measure whether the step got the job done.
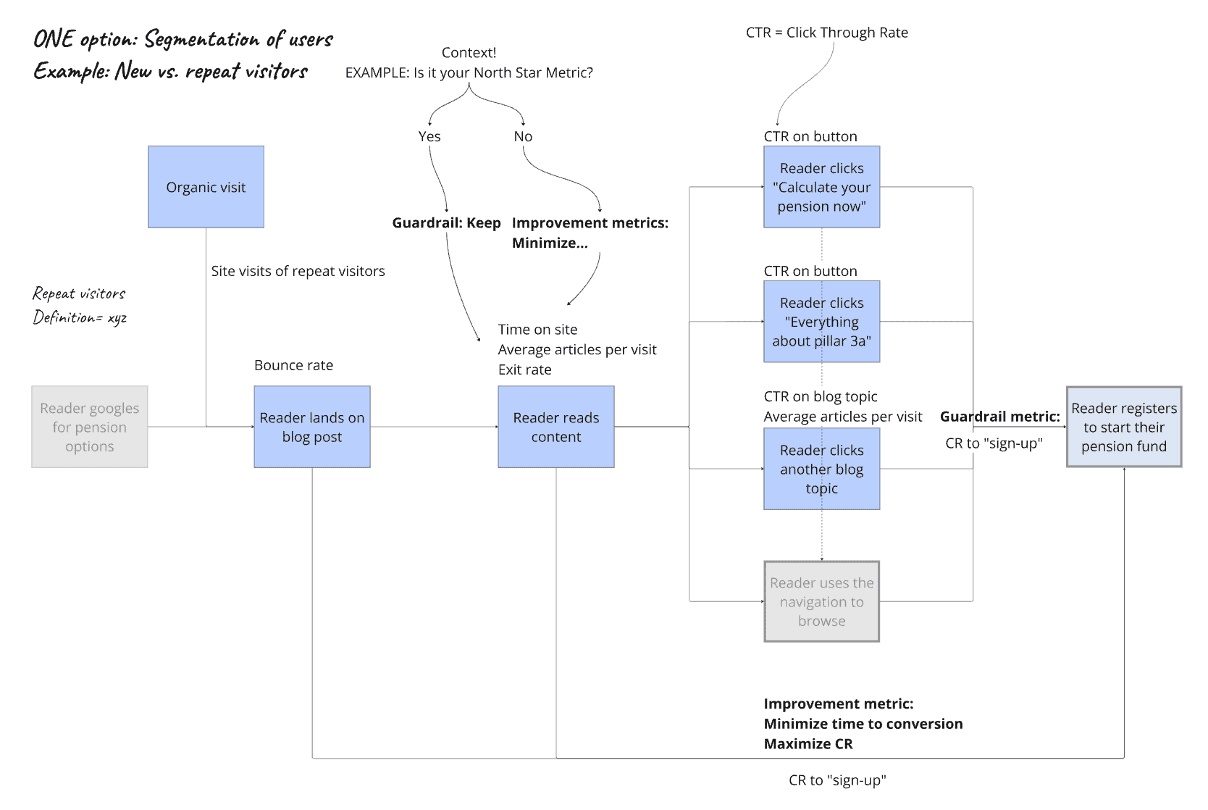 Example: Blog |
Defining Success Metrics
Now, defining success metrics might feel quite difficult. Especially in B2B I keep hearing "But we can't track and don't have enough data."
Let me assure you: You can quantify ANYTHING. When you know what signal will tell you that you are on the right way.
And this becomes easy when you know one of my all-time favourite frameworks:
The Goals-Signals-Metrics (GSM) by Google
When to use GSM:
You’ve built a feature but aren’t sure how to measure its success.
You’ve set up an experiment but don’t know which metric to use.
You’re creating a product dashboard and need a good metric to track.
When it works especially well:
Identifying leading indicators through behaviour change.
When the goal is intangible or difficult to measure.
When you lack data and are looking for proxy metrics.
For triaging your success metrics.Set metrics -> stress test against signals -> refine metrics
These are the exact 3 GSM Steps:
1. GOALS: This is the desired higher level outcome. Think of your goal as your final destination. What’s the big result you want to achieve?
2. SIGNALS: Watch out for the signals along your journey that tell you you’re on the right path.
3. METRICS: Translate these signals into measurements that show change over time. Make sure that these are SMART (Specific Measurable Achievable Reasonable Time-bound).
Example:
Goal: Increase sales for an online store.
Signals:
More users adding items to their cart.
More users completing purchases.
Users returning to shop again in your store.
Metrics: By the end of Q4:
Number of items added to carts increases month over month.
Conversion rate from cart to purchase increases by X%.
Repeat purchase rate increases by X%.
Now for all those of you who say "But we're in B2B, we don't have data to work with": Let me give you a B2B example from a client of mine that is operating in a very niche market with a few hundred of companies that they might count as their customers or leads.
Goal: Reduce the effort required by manufacturers in the enquiry process with retailers. More specifically: Increase number of offers sent per employee in the same period of time.
Signals:
It’s faster to create the offer document in the tool.
Getting to the right offer becomes faster.
They find almost everything they need to create the offer in the tool itself.
Metrics: By end of this year,
In the tool: Time between first setup of the offer to click "create offer"
Reduce number of clicks to get to the offer. (which in return should influence metric 1)
Release 1: Reduce number of tools they use from 7 to 5.
Release 2: … from 5 to 2.
Originally, GSM was published by Google in combination with the HEART framework. You can download the paper here or if the link doesn't work simply Google or LLM for "Google publication HEART framework". Here is an example GSM x HEART table from my friend Ant Murphy:
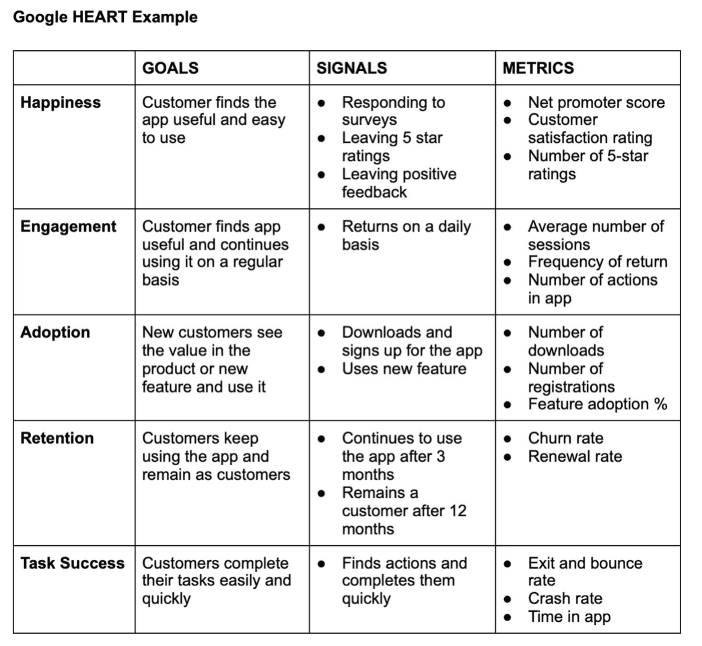 GSM x HEART by Ant Murphy |
The twist is simply that we use the GSM mental for any goal that we are supposed to work towards.
When you're stuck with your goal or with finding relevant success metrics, breath a little and try GSM.
Product management insights, delivered to your inbox
Sign up for weekly product insights. No spam.